Exposure to contaminant lead remains a public concern because of its pervasiveness in the environment and increasing evidence of its sublethal toxicities at exposure levels lower than previously thought harmful. In response to these concerns, there have been orders-of-magnitude reductions in atmospheric emissions of industrial lead, which has resulted in a pronounced decrease in blood lead levels in the U.S. and elsewhere. Now, the most common route of exposure to the general population, in countries in which leaded gasoline has been banned, is through the ingestion of food and water contaminated with lead.1
Although there are numerous published studies on the concentration of lead in wine, only a handful have looked at the concentration of lead in vinegar. 2,3 While some of these studies measured the lead in vinegar or wine directly after simple dilution, quite often a sample cleanup step was employed prior to the instrumental analysis. This pretreatment is often needed because, in addition to acetic acid and alcohol, both vinegar and wine contain suspended particles and polymeric organic compounds, particularly sugars, which interfere with graphite furnace atomic absorption spectrometry (GFAAS) and inductively coupled plasma-mass spectrometry (ICP-MS) measurements.
Two types of oxidation are most common: acidification and irradiation. Wet digestion using nitric acid is usually employed to oxidize the organic matter, and these oxidative digestions are often accelerated by heating the samples in PTFE or other inert and trace metal clean containers on a heating block or heating plate. The addition of hydrogen peroxide also speeds up the oxidation process, but most peroxides contain relatively high amounts of lead. Alternatively, ultraviolet and/or microwave energy have also been used to oxidize the organic matter in wine,4 which is a precursor of many vinegars. In this study, the relative accuracy and efficacy of two different (instrumental) analytical and sample preparation (vinegar digestion) methods for measuring lead in vinegar were investigated.
Background
Vinegar is produced by a two-stage fermentation process of suitable sugar or starch containing agricultural material such as grapes, apples, rice, garlic, or even onions.5 In addition to vinegar from red and white wine, there are special products such as vinegar from Jerez (sherry vinegar) in Spain or balsamic vinegar from a specific region of Italy, Modena. Aceto Balsamico di Modena is a typical Italian product created from fresh grape must, which is concentrated up to one-third of its original volume by a slow heating process. The traditional method of production requires storage in different wood barrels for up to 25 years. Another balsamic vinegar is produced by blending the concentrated must with acetic acid, and the mixture is allowed to mature in wooden barrels to develop the typical organoleptic properties.5
Consequently, there may be pronounced differences in the organic composition of different types of vinegars, including different balsamic vinegars. There may also be large variations in the lead concentrations of different vinegars, based on the origins of the ingredients and the production process. Both of those variables complicate accurate and precise measurements of lead in vinegar.
Experimental
Reagents
All solutions were prepared with deionized water (18 MΩ cm–1) from a Milli-Q (MQ) analytical reagent-grade water purification system (Millipore, Bedford, MA). Calibration standard solutions and internal standards were prepared from commercial lead standard solution (Spex Plasma, Edison, NJ). Trace metal grade (TMG) nitric acid and hydrochloric acid (Fisher Scientific, Pittsburgh, PA) were used for cleaning laboratory ware. Optima-grade nitric acid (Fisher) was used for the preparation of calibration standard solutions and analytical solutions. High-purity hydrogen peroxide, 30% (Ultrapur, Bayer, Pittsburg, NJ), together with nitric acid, was used for both heat and UV digestions. An NH4H2PO4/Mg(NO3)2 matrix modifier (Environmental Express, Mt. Pleasant, SC) was used for GFAAS analysis.
Instrumentation
- ICP-MS. All ICP-MS measurements were made with an Element magnetic sector high-resolution ICP-MS using a Glass Expansion Conikal nebulizer, a Scott-type double-pass spray chamber (cooled to 10 °C), and standard nickel cones (all from Thermo-Finnigan, Bremen, Germany). Since there were small or no polyatomic interferences for lead, it was analyzed at low resolution (r = 300) using 209Bi as an internal standard.
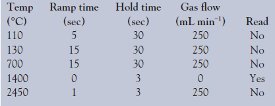
- GFAAS. GFAAS analyses were made on an SIMAA 6000 instrument fitted with a Zeeman background corrector and AS72 autosampler (all from PerkinElmer, Shelton, CT). End-capped, traversely heated pyrocoated graphite tubes with an integrated L’vov platform (PerkinElmer) were used. A lead electrodeless discharge lamp (PerkinElmer) was employed at the recommended line of 283.3 nm and a lamp current of 450 mA. Magnesium nitrate (Mg(NO3)2)/ammonium phosphate (NH4H2PO4) was used as a chemical modifier. The optimized GFAAS program, based on tests conducted for this application note (see following section on GFAAS program optimization), is shown in Table 1.
Table 1 - Optimized GFAAS program for measuring lead concentrations (μg L–1) in vinegar, following acid, UV, and/or microwave digestions
Samples
Vinegar samples were purchased from retail stores in California. Fifty-two different types of balsamic vinegar, four wine vinegars, one apple cider vinegar, one rice vinegar, and one garlic vinegar were analyzed. The vinegars were mostly in glass bottles, but some were in plastic or ceramic bottles.
Contamination control
The exteriors of the bottles were rinsed with deionized water before opening in a HEPA-filtered (Class 100) trace metal clean laboratory. Aliquots were placed in PTFE digestion vessels that were cleaned with Micro-90 liquid laboratory-grade detergent (Cole-Parmer, Vernon Hills, IL) and deionized water when first used or after an incomplete digestion. Subsequently, digestion vessels were recleaned by soaking them overnight in 8 M trace metal grade hydrochloric acid followed by at least 8 hr in hot TMG nitric acid. The vessels were then rinsed with reagent water and dried under Class 100 HEPA- filtered laminar flow air. All other plasticware (polyethylene or PTFE) used for storing analytical solutions was cleaned using the same procedure, dried, capped, and stored under Class 100 HEPA-filtered laminar flow air or double-bagged in trace metal clean, self-locking plastic bags. The GFAAS was in a HEPA-filtered air room and directly beneath a HEPA-filtered (Class 100) laminar flow canopy within a plastic enclosure.
Vinegar digestions
- Heating block digestions. Analytical portions were weighed (0.5–1.0 g) into PTFE digestion vessels, and 10 mL of TMG nitric acid was added. Vessels were covered loosely with acid-cleaned PTFE lids and placed in the heating block (CPI International, Santa Rosa, CA). They were initially digested at 50 °C for 2–3 hr to avoid sputtering; then the temperature was increased to 90 °C and digested to dryness. After cooling, the digests were dissolved in 1 M TMG nitric acid, producing a clear to light yellow analytical solution. These were then analyzed for their lead concentration by GFAAS or ICP-MS.
- UV digestions. The UV digestion unit consisted of a medium-pressure mercury vapor discharge tube (1200 W, Hanovia, Union, NJ) positioned on the ceiling of a purpose-built aluminum housing (36 cm × 29 cm × 23 cm, UVO-cleaner model 342 [Jelight Inc., Laguna Hills, CA]), which was cooled by a fan. A digital photometer (model JL1400A, Jelight Inc., Irvine, CA) was used to monitor the power of the UV radiation during the oxidation (x = 9.2 ± 0.4 mW cm–2 during the continuous operation of the Hg lamp).
The digestions were carried out by placing 16 custom-made PTFE 15-mL digestion cups fitted with quartz glass caps in the UV digestion unit. Vinegar samples (0.5 g) were weighed in tared PTFE vials. These and 1 mL of TMG nitric acid and 0.5 mL of 30% hydrogen peroxide were added prior to the UV treatment.
Quality control
Sample batches consisted of 24 analytical portions including several duplicate samples. Spikes of lead were added (90–150 ng mL–1) prior to digestion to several vinegar analytical portions representative of the variety of products. Check standard solutions were analyzed after every 10 analytical solutions to ensure instrument performance. Each analytical batch contained at least three method blanks, three spiked analytical samples, and three reference materials. Because there is no commercially available certified reference material (SRM) for lead in vinegar (or wine), NIST 1640 standard reference material (SRM) for trace metals in natural waters (NIST, Gaithersburg, MD) was used with a lead concentration (where x is the mean ± SD) of 27.89 ± 0.14 ng mL–1 to monitor the extraction efficiency of the digestion process.
Results and discussion
Nitric acid digestion
The authors’ attempt to analyze vinegar with or without dilution by either GFAAS or ICP-MS resulted in erroneously high lead concentration values (compared to nitric acid digested vinegar) and relatively poor precision (SD ≥ x). This analytical variability is illustrated in Table 2, which is a summary of the lead determination in four different types of balsamic vinegar (six replicate digestions or analyses). Because of their complex organic content, these vinegars proved to be the most difficult to analyze by GFAAS or ICP-MS with and without a prior nitric acid digestion.
Table 2 - Comparison of lead concentrations in four different balsamic vinegars analyzed by GFAAS and ICP-MS with and without nitric acid digestion
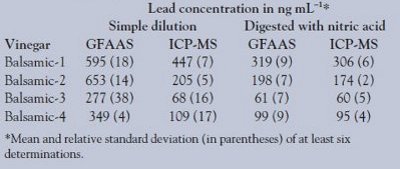
Specifically, measurements with both types of instruments yielded significantly higher (p = 0.05, paired t-test) lead concentrations in balsamic vinegars after simple aqueous dilutions compared to measurements after acid digestions. The disparity was greater in direct analyses of undigested diluted vinegars by GFAAS. In addition to vinegar matrix interferences, the authors noticed irreproducible sample deposition on the graphite tube due to adhesion of vinegar solutions to the PTFE GFAAS deposition tubing. Moreover, this problem persisted even after filtering and/or diluting the vinegars.
The agreement and precision of the analyses between the two instruments were greatly improved (r = 0.997, m = 0.94, simple linear regression) after nitric acid digestions. These improvements are attributed to the oxidation of organic matter. This destruction eliminates interferences resulting from nonspecific absorption and scattering of light due to concomitant species in the vinegar solutions.
UV and heat digestion
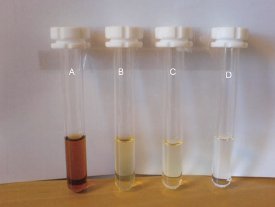
Figure 1 - Sample pretreatment prior to GFAAS or ICP-MS of a typical balsamic vinegar sample. a) 1:14 dilution of 0.5 g vinegar with 1 M HNO3, b) 0.5 g vinegar digested to dryness in a heating block at 90 °C reconstituted to 1 M HNO3 with MQ water, c) similar treatment as in (b) but with addition of 0.1 mL hydrogen peroxide, d) 0.5 g vinegar + 0.5 mL HNO3 + 0.1 mL 30% H2O2 irradiated with UV for 1 hr diluted 1:14 with MQ water.
Nitric acid, and to a lesser extent hydrogen peroxide, are widely used for wet digestions of organic and inorganic matter prior to instrumental analyses of metals. The oxidative digestions are accelerated by heating the samples in PTFE or other inert, trace metal clean containers on a heating block or heating plate. Those thermal energy sources are now often being replaced by microwave and UV radiation in sample preparations in which acid digestion is necessary, because they may be faster and may be done within a closed system.6
Comparing the two methods, nitric acid digestions with UV radiation were faster than those with heating blocks. The digestions were more complete and virtually indistinguishable from MQ water blanks, as can be seen in Figure 1.
While the addition of hydrogen peroxide further enhanced the degradation of organic material in the vinegars, the amount of contaminant lead in the trace metal grade hydrogen peroxide used was relatively high (~15 ng mL–1) and comparable to the lead concentration in some of the vinegars. Thus, cleaner hydrogen peroxide is necessary for digestion of vinegars with lead concentration at the low- to sub-ng mL–1 level.
GFAAS analysis
Although the instrument manufacturer (PerkinElmer) recommended maximum ashing and atomization temperatures of 400 °C and 1400 °C, respectively, in the furnace program for lead determination, the use of chemical modifiers allows much higher temperatures, and ashing and atomization temperatures of up to 1000 °C and 1800 °C, respectively, have been reported.7
In the absence of a vinegar or similar matrix certified reference material, optimization of the furnace program was initially started using digested vinegar spikes and NIST SRM 1640 (natural water) that had undergone a nitric acid digestion process similar to the vinegars. The manufacturer’s recommended ashing and atomization temperatures were used with an Mg(NO3)2/NH4H2PO4 chemical modifier. Ashing and atomization temperatures of 800 °C and 1400 °C, respectively, were found to be optimum for the analysis of digested natural water SRM and quantitative recovery. However, the same furnace program produced low lead recoveries of spiked digested vinegar samples.
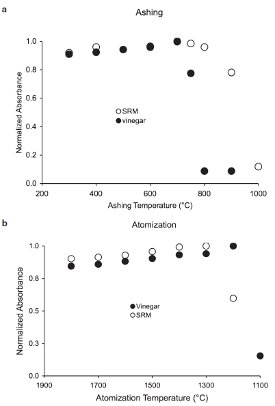
Figure 2 - Variation of absorbance with GFAAS ashing and atomization temperatures for NIST 1640 natural water SRM and balsamic vinegar after nitric acid (65% m/m) digestion.
An investigation of the GFAAS measurements of vinegar digests with lead concentrations similar to the SRM showed a sharp drop in absorbance between 700 °C and 800 °C of the digested vinegar samples, but not for the SRM. This disparity is shown in Figure 2. It contains plots of the variation of absorbance during ashing and atomization temperature steps of the two types of samples.
Curvatures in both plots indicate that the digestion of the vinegar samples produced a relatively labile lead compound(s). Their volatilization between 700 °C and 800 °C markedly altered the measurements of lead concentrations of the vinegar, which was not replicated in the measurements of lead in the SRM. This thermal variability underscores the importance of close investigation of the furnace program optimization for different sample types and matrices.
Quality control
Process blanks (reagent water) were also analyzed together with the samples. The mean blank lead concentration was 0.03 ng mL–1 (n = 4) with a standard deviation of 0.04, giving a detection limit of 0.12 ng mL–1 analyzed by GFAAS after nitric acid and heat digestion. The spike recovery (x ± SD) of six different vinegars was 96 ± 5%, while the mean recovery of NIST 1640 SRM digests was 97.4 ± 1.3%. The relative standard deviation for duplicate analysis was <8%.
Lead concentrations in vinegars
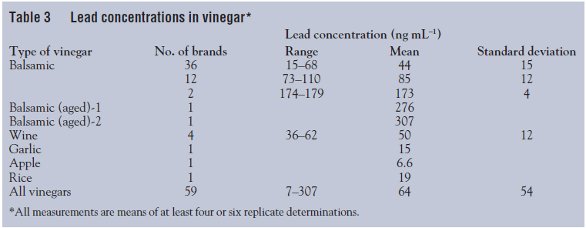
Table 3 summarizes the results of the measurements. Again, these included analyses of lead concentrations in 52 different types of balsamic vinegars, four wine vinegars, one apple vinegar, one garlic vinegar, and one rice vinegar. The concentration of lead in the balsamic vinegars ranged from 14.9 to 307 ng mL–1, with a mean of 68 ± 56 ng mL–1.
It is notable that the balsamic vinegar (n = 6) with the highest lead concentration (307 ± 19.5 ng mL–1) was reportedly produced by the traditional method of production, which involved aging in different vintage wood barrels. Another balsamic vinegar with a high lead concentration (257 ng mL–1) had reportedly been aged for 18 years. The authors therefore hypothesize that most of the lead in those vinegars comes from their contact with contaminant lead surfaces during production and storage, possibly metal fittings securing the barrels used to age the vinegars. This hypothesis is based on the results of several studies of the sources of lead contamination in grape wine,8,9 because there are no published studies on the sources of lead contamination in vinegar. Both wine studies8,9 found the production and storage process to be the main source of lead contamination rather than the grape or the soil. For example, Almeida and Vasconcelos8 found that only a about a quarter of the total content of lead in Portuguese fortified and red table wines, respectively, came from soil and atmospheric deposition, and that the rest of the lead was introduced in the vinification processes. They concluded that marked reductions of the lead content in the wines would occur if the sources of lead were removed from the tubes and containers used in the vinification system, particularly by employing welding alloys and lead-free fittings. They also observed that wines produced via traditional vinification methods had a higher lead concentration compared to those produced by modern technology.
Table 3 - Lead concentrations in vinegar*
Conclusion
Lead concentrations in different types of vinegar vary from less than 10 to more than 300 ng/mL, and the accuracy and precision of those lead concentration measurements with different protocols may also vary widely. Direct determinations of lead in vinegar by ICP-MS and GFAAS may provide irreproducible measurements and give poor agreement between the two types of instrumental analysis, but there is good agreement in measurements with the two types of instrumental analysis after vinegar is digested with nitric acid.
While use of nitric acid and evaporative digestion in heating blocks is an effective and clean method of processing vinegars prior to ICP-MS and GFAAS analysis, nitric acid digestions with UV photolysis reduce the time required to process the vinegar and increase the oxidation of its organic constituents. Although the digestion times may be further enhanced with the addition of hydrogen peroxide, the amount of contaminant lead in TMG hydrogen peroxide is too high for measurements of lead concentrations in vinegars with concentrations < 50 ng mL–1. Therefore, the authors recommend nitric acid digestion of vinegars before ICP-MS or GFAAS determination, and that the latter measurements use ashing and atomization temperatures of 600 °C and 1300 °C, respectively, rather than the manufacturer’s recommended settings, because of the apparent volatilization of relatively labile forms of lead in vinegars above those temperatures.
References
- CDC, Toxicological Profile Information: Toxic Profile for Lead, CDC, Centers for Disease Control and Prevention, Agency for Toxic Substances and Disease Registry (ATSDR), 1999. www.atsdr.cdc.gov/ toxprofiles/, accessed October 6, 2003.
- Gonzalez, A.M.T.; Chozas, M.G. Metallic contaminants in Andalusian vinegars. Nahrung1988, 32, 743–8.
- Acosta, A.; Diaz, C.; Hardisson, A.; Gonzalez, D. Levels of cadmium, lead, and nickel in different types of vinegars. Bull. Environ. Contamin. Toxicol.1993, 51, 852–6.
- Almeida, C.M.R.; Vasconcelos, M. UV-irradiation and MW-digestion pre-treatment of Port wine suitable for the determination of lead isotope ratios by inductively coupled plasma mass spectrometry. J. Anal. At. Spectrom. 1999, 14, 1815–21.
- Tesfaye, W.; Morales, M.L.; Garcia-Parrilla, M.C.; Troncoso, A.M. Wine vinegar: technology, authenticity and quality evaluation. Trends Food Sci. Technol. 2002, 13, 12–21.
- Jin, Q.H.; Liang, F.; Zhang, H.Q.; Zhao, L.W.; Huan, Y.F.; Song, D.Q. Application of microwave techniques in analytical chemistry. Trac-Trends Anal. Chem.1999, 18, 479–84.
- Freschi, G.P.G.; Dakuzaku, C.S.; de Moraes, M.; Nobrega, J.A.; Neto, J.A.G. Simultaneous determination of cadmium and lead in wine by electrothermal atomic absorption spectrometry. Spectrochim. Acta Part B—At. Spectrosc. 2001, 56, 1987–93.
- Almeida, C.M.R.; Vasconcelos, M. Lead contamination in Portuguese red wines from the Douro region: from the vineyard to the final product. J. Agricul. Food Chem. 2003, 51, 3012–23.
- Kristol, J.; Veber, M.; Slekovec, M. The application of ETAAS to the determination of Cr, Pb and Cd in samples taken during different stages of the winemaking process. Anal. Bioanal. Chem. 2002, 373, 200–4.
Dr. Ndung’u is Assistant Professor, Dept. of Applied Environmental Science (ITM), Stockholm University S-106 91, Stockholm, Sweden; tel.: +46 8 674 7236; fax: +46 8 674 7636; e-mail: [email protected]. Ms. Hibdon is a Researcher, and Dr. Flegal is Professor and Chair, Dept. of Environmental Toxicology, University of California at Santa Cruz, Santa Cruz, CA, U.S.A. The authors are grateful to Ana Gonzalez for help with vinegar digestion and Rob Franks for help with the ICP-MS analysis. This research was funded by Bushnell, Caplan and Fielding (Oakland, CA).