In today’s fast-paced business environment,
many companies are under
pressure to improve their productivity.
This is especially true in the pharmaceutical
industry, where reducing
time-to-market for new drug products
and late-stage attrition of drug candidates
are major productivity-related
(as well as cost-related) issues.
In the organic synthesis laboratory,
one way to improve productivity is to
ease the bottlenecks associated with
analyzing samples and interpreting
data. This allows chemists to determine
the results of their experiments
more quickly. The faster chemists can
obtain these results, the faster they
can make judgments about the next
experiments, and the more productive
they become.
Infrared spectroscopy is a proven tool
for organic synthesis-related applications.
The relatively rapid analysis
time of an FTIR instrument, coupled
with the ability of infrared spectroscopy
to provide functional group
information, makes it effective for
material identification, reaction monitoring,
polymorph characterization,
and formulation verification. However,
due to historically tedious sample
preparation and data interpretation,
plus the fact that a synthesis
laboratory environment
is not normally
conducive to the operation
of a sensitive spectrometer, IR has
given way to other
techniques such as HPLC for most routine
analyses.
Miniaturized FTIR customized
for
organic chemistry
applications

Figure 1 - ChemID analysis system customized for
organic chemistry applications.
The ChemID system (Smiths Detection
Scientific, Danbury, CT) (Figure 1) is a
rugged, compact, and lightweight FTIR
(less than 25 lb with a footprint of only 7
× 15 in.) that can be easily used outside
of the traditional analytical laboratory
setting, wherever it is needed, even in a chemical fumehood. Using a diamond
attenuated total reflection (ATR) sample
interface, the analysis of liquid or
solid samples can be performed without
any sample preparation. The integrated
90× video microscope permits the operator
to view (and record an image of)
exactly what is being analyzed.
ChemAssist software (Smiths Detection
Scientific), which operates
the ChemID system, has
been customized specifically
for synthetic chemistry tasks
such as reaction monitoring,
solid form characterization,
and material identification.
Featuring a simplified user
interface, the software contains
powerful algorithms
that make it easy for a nonspectroscopy
expert to
extract the desired information
from the IR spectra collected
with the system.
Diamond ATR operation
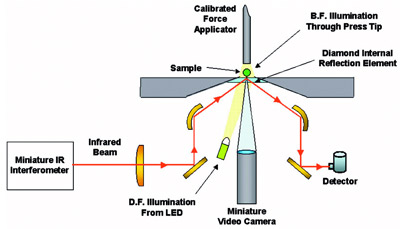
Figure 2 - Diagram of diamond ATR sample interface.
The principle of operation for the diamond
ATR optics is depicted in Figure 2.
Because of its superior chemical resistance
and hardness, use of a diamond
sample surface allows the analysis of the
broadest range of samples, including
caustic, corrosive, and abrasive materials.
Even gritty solids cannot harm the
surface. Because the surface can be
cleaned quickly with a solvent-wetted
laboratory tissue, analyses can be performed
at short intervals—typically less
than 1 min.
To perform an analysis, a sample is
placed on the diamond internal reflection
element. Sample viewing is aided
by using the built-in darkfield (DF) or
brightfield (BF) illumination. The
infrared beam from the miniature interferometer and the optical light
for darkfield illumination arrive at the
center of the element from below. The
brightfield illumination path is
through the tip of a specially designed
force applicator that contains a sapphire
insert. The operator can see
exactly what he or she is analyzing on
the integrated monitor so that, for
example, crystal shape can be confirmed.
For solid samples, the force
applicator is moved into position to
contact the sample; a digital readout
displays the force applied. The force applicator is not used with liquid samples.
Both IR spectra and video images
can be collected using ChemAssist
software’s infrared and image capturing features.
Convenient and simplified
reaction analysis

Figure 3 - ChemID operating in a fumehood.
Unlike traditional laboratory FTIR
systems, ChemID is small and rugged
enough to be placed in a chemical
fumehood (Figure 3) or on a nearby
bench in a synthesis laboratory, where
space for such equipment is usually
limited, and where the environment
for spectrometers is not ideal. This
makes it much more convenient for
the chemist to take advantage of
infrared spectroscopy for monitoring
the progress of chemical reactions. In
addition, the powerful ChemAssist
software helps nonspectroscopists
identify spectral bands for monitoring
the functional groups involved in the
reaction. Even for the IR spectroscopy
expert, this software makes reaction
analysis faster and easier to perform
than with traditional methods. As an
option, the software can include
libraries of more than 25,000 individual
spectra, and can be customized for
users to add their own proprietary
library of compounds.

Figure 4 - QuickTrakIR confirms that changes in the spectra at
1745 cm–1 are due to the formation of an aliphatic acetate.
For many reactions, the user may
simply want to know if a reaction has
initiated and if the desired product or
intermediate is being formed. For
these situations, the ChemAssist
software’s QuickTrakIR™ feature
allows the user to
easily recall and display
the spectral
signature information
for the functional
groups of
interest to see if the
required peaks are
present and changing
(see Figure 4).
This feature makes
it easy for the user
to make judgments
in seconds regarding
the progress of
the reaction, thus
permitting him or
her to move on to
the next activity
more quickly than
with techniques that require longer
analysis times.
ChemID is especially effective for
react ion analysis in situations
where HPLC analysis may be difficult.
A common example is when
the target analyte does not contain
a chromophore, which is needed for
detection when using the most
common HPLC detectors. Other
examples include analyte compounds
that are not stable with
respect to HPLC solvents, air- and
moisture-sensitive materials, and
reagents and catalysts that may be
harmful to the HPLC column.
Reaction profiling
In other situations, especially when
trying to optimize a specific reaction,
it is helpful to have a better understanding
of the reaction kinetics. This
is usually accomplished by creating a
time-based profile for all reaction
components: reactants, intermediates,
and products. To set up a
method for time-based profiling of a
reaction, the analyst first inputs the
chemical structures and IR spectra for
all components of the reaction using
standard chemical-drawing tools for
structures. The spectra for the reaction
components may be recalled
from a directory of spectrum files or
may be easily collected in just a few
seconds using ChemID.
In the next step, which requires only
a single click by the user, the software
uses a sophisticated algorithm
to examine each of the chemical
structures and break them down into
a list of the functional groups present.
It then compares the lists and, along with the spectra entered, presents
the user with a number of suggested
bands, with their corresponding
functional groups, to monitor for
the reaction.
While the chemical reaction is taking
place, the analyst pulls samples periodically
from the reaction vessel and
analyzes them. As the samples are
analyzed, the software automatically
builds a time-dependent profile of the
reaction progress.

Figure 5 - Reaction profiles generated using ChemID with ChemAssist software.
Figure 5 shows reaction profiles built
by tracking a C–O out-of-phase
stretch band for the reactant and a
C–O stretch band for the product.
These bands were suggested by the
software based on the structures
entered by the user. In the case of
the reactant, each sample point
shows a decrease in the intensity of
the tracked band until, finally, the
band disappears, indicating that the
compound containing it has been
consumed and the reaction is complete.
Likewise, the increasing profile
for the product indicates that
the product is formed on the same
time scale. Armed with this easily
obtained information about the
reaction, the user can quickly move
on to the next steps for optimizing
the reaction.
Solid form characterization
In this example, ChemID was used
to characterize furosemide crystals.
Furosemide crystallizes into different
polymorphic forms depending
on the temperature and solvent
used. Each form has a unique IR
spectrum and crystal habit. The preferred
form in this example consists
of needle-like structures.

Figure 6 - a) Spectrum and 90× video image for furosemide recrystallized from n-butanol, compared
with reference spectrum for preferred form. b) Library search results indicating match with
preferred form.
Various approaches were used to
make the preferred form without
co-crystallizing other forms or solvates. Figure 6a shows IR data
obtained on recrystallization of
furosemide from n-butanol along
with a 90× video image collected
for the sample. A reference spectrum for the prefer red form is
shown as the lower IR trace. A
comparison of the actual and reference
IR data and the appearance of
needle-like crystals in the image
suggest the preferred form. Verification
is done by a single mouse
click, which initiates a search of
known forms and selects the closest
match (Figure 6b).
Summary
The ChemID FTIR is an easy-to-use,
fast, and versatile tool customized for organic chemistry
applications. It can accept samples
with little or no preparation—solids, liquids, powders, gels, and
pastes—right from the reaction vessel
if needed. Combined with
ChemAssist software, it is a useful
tool for reaction analysis, polymorph
screening, and other material
identification applications. It
offers a new model for chemical
detection, identification, and measurement,
one in which the confines
of the traditional laboratory
are eliminated, where IR expertise
is contained within the instrument,
and where results are immediate.
Dr. Fredeen is Senior Product Manager, Dr.
Seelenbinder is Microscope Product Manager,
and Dr. Norman is Application Scientist,
Smiths Detection Scientific, 14 Commerce
Dr., Danbury, CT 06810, U.S.A.; tel.: 203-207-9700; fax: 203-207-9780; e-mail: [email protected].