Compact, array-based spectrometers
continue to develop in response to
advances in detector, microprocessor,
storage, and display technology. At
the present time, this class of instruments
has essentially divided into
two different product paths. So-called
“smart” spectrometers are self-contained
instruments with an on-board
microprocessor, as well as data
storage, analysis, and display capabilities.
The latest of these instruments
even offers battery operation for true
portability. The other class of instruments,
which comprises essentially a
spectrometer engine, uses a host
computer to provide all storage, analysis,
and display functions.
In applications that involve both
laboratory and field operation, it can
be highly advantageous to have both
types of instruments, provided they
are based on a common optical platform
or spectrometer engine. This
commonality ensures robust transfer
of the calibration model developed
in the laboratory into the on-line or
OEM measurements. This article
briefly reviews the operation of
these types of spectrometers and
examines a semiconductor processing
application that relies on a
robust model transfer.
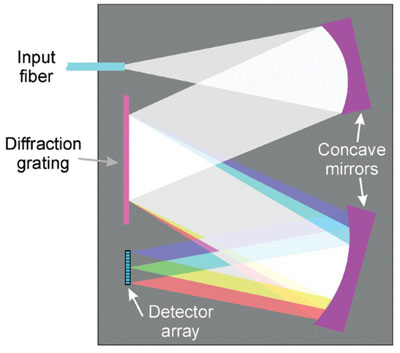
Figure 1 - An array-based spectrometer uses a compact
optical arrangement with a stationary diffraction grating to
enable simultaneous acquisition of data at multiple wavelengths,
with no moving parts.
The basic components of a typical
array-based spectrometer include an
entrance aperture, collimating optics,
fixed-position diffraction grating,
focusing optics, and linear photodetector
array (Figure 1). This configuration
offers several advantages over
the traditional scanning geometry,
including compact size, immunity to
vibration, and the ability to acquire
all wavelength components of a spectrum
simultaneously. The
latter minimizes data
acquisition time and
makes the instrument relatively
immune to transient
noise effects such as
a bubble passing through a
flow cell sampling unit,
since all data points are
affected equally.
In analytical applications,
the spectral data are used
for sample identification
or, more commonly, to
derive quantitative analytical
information about the
composition of samples.
This process can involve
measuring the relative
intensity of a few select
spectral peaks for a more
complex fit, such as PLS
(partial least squares), on multiple data
points. In the case of near infrared (NIR), this may require a complete
spectral fit using chemometrics.
Whatever model/algorithm is used to
extract the target information, in virtually
every case the fit is specific to the
spectrometer hardware. This is because
the raw data depend on the spectrometer
engine—the particular optics, grating,
and detector array used, and the
exact arrangement of these components.
In a given application, it is thus
critically important that all the instruments
are based on a common spectrometer
engine, which allows the
same software-fitting model to be used
confidently with all the instruments.
Self-contained versus
computer-interfaced
Because repeatable data fitting
requires consistent instrumentation,
it would seem simple to conclude
that identical instruments should be
used at all stages of calibration and
implementation for a given application.
However, for many applications,
this does not make sense from a
cost standpoint. This is because the
applications developer typically
needs an instrument with greater
flexibility and functionality, and
hence higher cost, than the production
line or OEM user.
To meet these diverse needs, today’s
instrument providers offer both
computer-interfaced spectrometers
and smart, self-contained instruments
equipped with functionality that goes
well beyond simply dispersion and
detection. These capabilities fall into
four categories: data storage, data display,
data analysis, and data transfer.
Data storage can take several forms.
Traditionally, disk drives were the method of choice for data storage,
but today’s technology
offers solutions that draw much
less power and occupy less
space. Data storage now is typically
offered in the form of
built-in, solid-state memory,
supplemented by removable
flash memory cards or sticks,
not unlike the arrangement in
a digital camera of the consumer
market.
For data display, liquid crystal
display (LCD) screens are
well suited for a compact
and/or portable instrument. These
are smaller, lighter, draw less power,
and are more rugged than their cathode
ray tube (CRT) predecessors.
Furthermore, in addition to just displaying
data, the use of smart touchscreen
technology enables the user
to interact with the system software
through a graphical user interface
(GUI). This provides simplified
access to a wide range of data analysis
and instrument control functions
in a compact, economical package.
The incorporation of data analysis
capabilities enables an operator to
perform different types of measurements,
including absolute measurements,
optical density, background
subtraction, and so forth. It also permits
other mathematical manipulations
of the data, such as addition or
subtraction of spectra or individual
data points or values. The software
typically provides a choice of data formats,
including SPC (GRAMS Standard)
and CSV.
Data transfer can take several forms.
Serial (RS232) interfaces are still
common, but most high-performance
instruments now offer a choice of a
GPIB parallel interface as well as an
Ethernet input/output and a USB
link. These interfaces not only allow
data transfer but also enable remote
operation of the spectrometer from a
host computer.
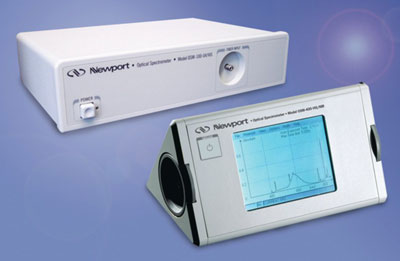
Figure 2 - Instruments based on the same spectrometer
engine can offer quite different levels of functionality,
as in the OSM-100 and OSM-400.
The diverse needs of the applications
marketplace mean that instrument
manufacturers now often offer two or
more versions of the same spectrometer
(Figure 2). The most basic version
has virtually none of these
higher-level functions and is
intended for operation with a dedicated
PC in the case of an end user,
or by the system computer in the
case of an OEM application. An
example of this type of instrument is
the OSM-100 (Newport Corp.,
Irvine, CA). Conversely, self-contained
instruments can be based
on the same spectrometer engine,
but offer some or all of the above
functions, and may even include battery
operation for true portability.
An example of this latter type is the
OSM-400 (Newport Corp.).
Cobalt cap technology for
high-density ICs
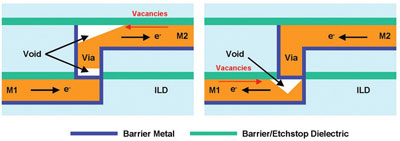
Figure 3 - In state-of-the-art integrated circuits, high current densities in
the miniaturized copper interconnects can result in migration of the copper
atoms. This can lead to voids and failed interconnects, lowering device reliability.
The problem can be largely reduced by the use of a CoWP barrier layer.
(Figure courtesy of Blue29.)
The innovative cobalt cap process, pioneered
by Blue29 (Sunnyvale, CA) for use in the
semiconductor industry, provides an excellent
example of a process in which calibration
must be maintained from laboratory to
factory floor. As chip manufacturers strive to
keep pace with Moore’s Law, the resultant
miniaturization presents problems in both
fabrication and device reliability. One of the
main reliability issues in high-density circuits
is failure of the copper interconnects that
link the multiple circuit layers. Specifically,
the thin cross-section of these interconnects
translates into high current density. This
causes a process called electromigration
(EM) in which copper atoms move in the
opposite direction to the flow of electrons.
EM thereby causes further thinning of the
interconnects, and higher current density,
which in turn drives even faster EM. Eventually,
this leads to the formation of voids in
the copper and failure of the interconnect
(see Figure 3). Copper atom migration mainly
occurs via the copper dielectric interface.
This results in the additional problem of
modifying the k value (dielectric constant) of the dielectric
layer.
To address this situation, the company has pioneered the
use of a cobalt alloy as an alternative barrier layer sometimes
referred to as a cobalt cap. Blue29 believes that its
cobalt layer has two advantages. First, the Cu-Co
metal–metal bond is theoretically stronger than a Cu
metal–dielectric bond; thus the interface between the copper
and the barrier layer prevents copper migration. In
addition, the cobalt itself is very resistant to migration.
Blue29 has also developed a proprietary wet-chemistry
process that directly deposits this CoWP layer on top of
exposed copper, without resorting to electrochemistry or
additional masking.
Spectroscopic process monitoring of cobalt
In the Blue29 process, wafers are immersed in a proprietary
mixture of chemicals in a wet process that results in catalytic
deposition of cobalt onto the copper interconnects.
Automation, high throughput, and minimum down time
are critical to the success of new processes in the semiconductor
industry. The cobalt cap system provides all three,
in part due to automated, real-time monitoring of the multicomponent
process solution. The company supplies the
hardware (chemical and wafer handling) specific to each
user’s needs and the hardware/software to monitor the
chemistry in a seamless manner. This allows the wafer manufacturer
to simply expose the wafers to the chemistry for a
finite time, knowing it will produce a specific target thickness
of CoWP.
Real-time monitoring of the process
solution is critical because key components
slowly become depleted
with repeat use. The solution is
automatically maintained by the
periodic recharging of these components
before eventual replacement.
This ensures constant cobalt deposition
characteristics. The company
monitors the various components
using several different techniques
that are all interfaced to the main
system controller for complete
automation. The cobalt ion concentration
is monitored by visible absorption spectroscopy, using a
deuterium-tungsten light source and
OSM spectrometers.
In Blue29’s laboratory, an OSM-400 is utilized along with a cuvette
holder accessory to study captured
samples from test platforms, and to
optimize new systems before customer
delivery. The OSM is
equipped with a 2048-element charge-coupled device (CCD) array
and a grating setup to disperse the
250–850 nm spectral window onto
this array. In the final product, an
OSM-100 with the same grating
and CCD is integrated into the
rack-mounted system controller.
The spectrometer is integrated with
a rugged housing and a 1 × 4-fiber
switch. This allows the system controller
to connect the spectrometer
with four different fiber bundles.
Two of these are connected to Z-shaped
flow cells, in two separate
process modules, to maximize system
throughput. One of the bundles
is connected to a flow cell in a
reference sample of deionized
water, and the fourth bundle is used
to monitor the condition of the
deuterium lamp for preventative
maintenance purposes.
The use of both an OSM-100 and
OSM-400 lowers the company’s
development costs and also minimizes
the cost of the final systems
shipped to its customers. The OSM-400 is used by the process development
engineers as a portable, shared
instrument to measure captured samples.
Its battery-enabled portability
also permits its use in the production
simulation environment to monitor
new systems during test and assembly,
avoiding the cost of multiple spectrometers,
which would not be in
constant use.
Conversely, the display, storage, and
analysis functions would be completely
superfluous in the production
systems shipped to Blue29 customers.
Here, one of the most
important functions is an Ethernet
input/output, since that enables
simple integration with the main
system computer. The OSM-100
provides this critical interface in a
cost-effective package. Clearly it is
a major advantage that both instruments
are based on the same spectrometer
engine, allowing robust
transfer of calibration models.
Conclusion
The ready availability of powerful
microprocessors and high-speed
interfaces has resulted in two categories
of compact optical spectrometers.
Self-contained instruments
now incorporate on-board data
analysis, storage, and display functions,
whereas computer-interfaced
instruments rely on a host computer
for all of these functions. The former
are ideal for laboratory and at-line
applications, and the latter are
generally better suited to on-line
and OEM applications. However,
some applications can benefit from
using both types of instruments,
provided they are built on identical
spectrometer engines.
The authors are with Newport Corp., 1791
Deere Ave., Irvine, CA 92606, U.S.A.; tel.:
949-437-9874; fax: 949-253-1800; e-mail:
[email protected].