In thermogravimetric analysis (TGA),
the weight of a sample is recorded as a
function of temperature or time under
defined atmospheric conditions. Quantitative
compositional analysis can be performed
and the reaction kinetics investigated.
Qualitative information on the
gaseous products evolved is obtained by
coupling the thermobalance on-line with
a mass spectrometer or FTIR spectrometer
(Figure 1). The data from the gas analyzer
are then compared with the TGA
weight loss curve. The weight loss derivative
and SDTA (single DTA) curves are
also often displayed to aid interpretation.
SDTA monitors temperature differences
due to enthalpy changes.
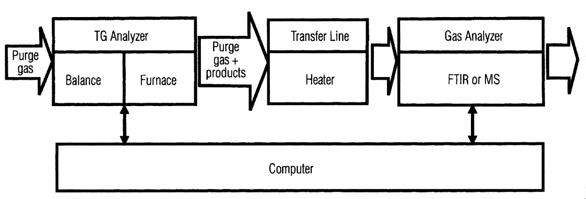
Figure 1 - The coupling of TGA and gas analysis.
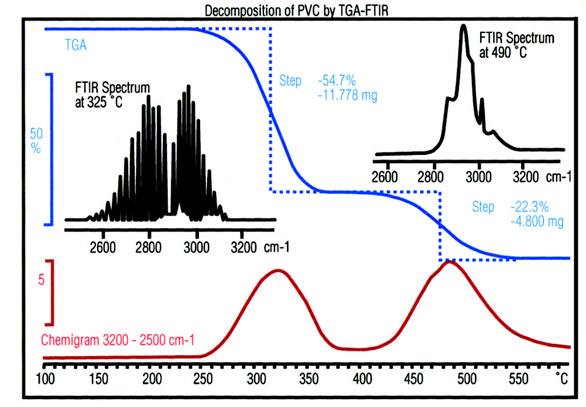
Figure 2 - The decomposition of CaC2O4 • H2O was investigated
by monitoring the m/z values 18, 28, and 44. The first
step in the TGA curve corresponds to the elimination of water of
crystallization, the second step to the release of carbon monoxide
from the anhydrous calcium oxalate, and the third step to the liberation
of CO2 from the calcium carbonate formed in the second
reaction step. The m/z 44 curve also shows that a small amount
of CO2 is formed in the second step. This effect is due to the disproportionation
reaction of CO to CO2 and carbon.
The TGA/SDTA851e (METTLER
TOLEDO, Columbus, OH) is coupled
to the MS via a heated quartz glass capillary
tube. One end of the glass capillary
is positioned close to the sample in
the thermobalance. Part of the evolved
gases is sucked into the capillary by the
vacuum in the MS. The MS repeatedly
measures either the entire mass spectrum
or, as shown in Figure 2, monitors
the intensity of characteristic fragment
ions (m/z, the mass-to-charge ratio).
The decomposition of calcium oxalate
monohydrate is shown as an example.
The TGA is coupled to the FTIR
spectrometer via a glass-cooled
transfer line. This
transports the volatile
products evolved during
the decomposition of the
sample to a gas cell
installed in the FTIR
spectrometer. Both the
transfer line and the gas
cell are heated to prevent
condensation of the
decomposition products.

Figure 3 - Thermal degradation of polyvinyl chloride (PVC)
measured by TGA-FTIR. The TGA curve and the chemigram
show two clearly defined steps. An FTIR spectrum measured at the
first maximum corresponds to HCl. However, the spectrum measured
at the second maximum is very different and is identified as
benzene formed through the cyclization of (–CH=CH–)n.
The FTIR spectrometer
measures the spectra of
the gases in the gas cell
rapidly at frequent intervals.
Afterward, a spectral
range characteristic
for a particular functional
group can be
selected and the infrared
absorption bonds in this
range integrated and displayed
as a function of
time. The resulting
curve, known as chemigram,
is a very useful way
to compare the results of
the spectroscopic analysis
with the TGA weight
loss curve (Figure 3).
Applications
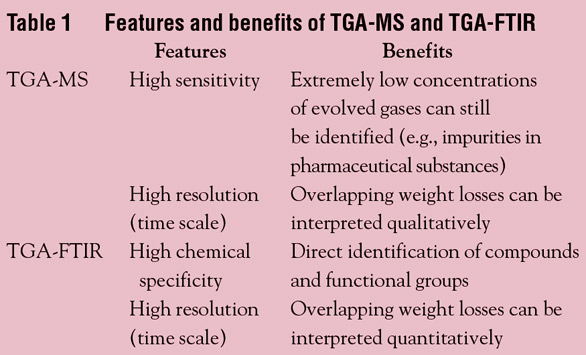
Hyphenated TGA-MS
or TGA-FTIR analysis is
an invaluable aid in
research and development,
and is also a very
useful tool for quality
control and the investigation
of material failure
or damage (Table 1). Typical applications
are:
- Detection and identification of
compounds (Figure 4)
- Characterization of raw materials
and final products (Figures 5 and 6)
- Chemical reactions (catalysis, synthesis, and polymerization)
- Thermal degradation processes
(oxidation and pyrolysis)
(Figure 7)
- Degassing and adsorption
behavior.

Figure 4 - Methanol and acetone were used to recrystallize
a pharmaceutical substance. Residues of both solvents
can be clearly detected by TGA-MS. The high temperature
observed for the elimination of the relatively large
amount of acetone indicates that acetone is more firmly
bound in the substance, possibly as a solvate.
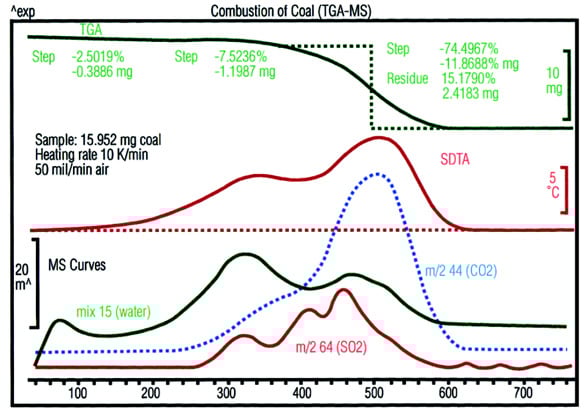
Figure 5 - The TGA curve shows three weight loss steps.
The first is due to evaporation of moisture. The combustion of
the coal takes place in the two steps that follow. The MS data
show that appreciably more water is evolved in the first of
these two steps. Besides carbon, a greater proportion of hydrogen
and hydrogen-containing compounds (e.g., CH4) is
burned. In addition, the formation of SO2 (m/z 64) proves
that sulfur-containing substances are present in the coal.
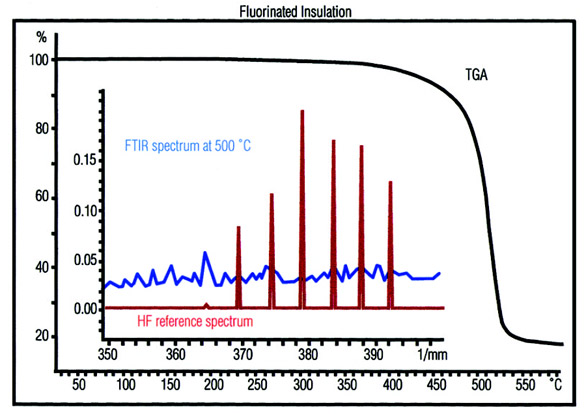
Figure 6 - Ethylene tetrafluoroethylene (ETFE) is used as
a cable insulation material. An important point is whether
hydrogen fluoride is formed when the material undergoes thermal
degradation. The TGA-FTIR data of a sample of ETFE
show that volatile additives are evolved from about 200 °C
onward. Degradation begins at about 440 °C. The FTIR spectra
prove that hydrogen fluoride is formed above about 450 °C.
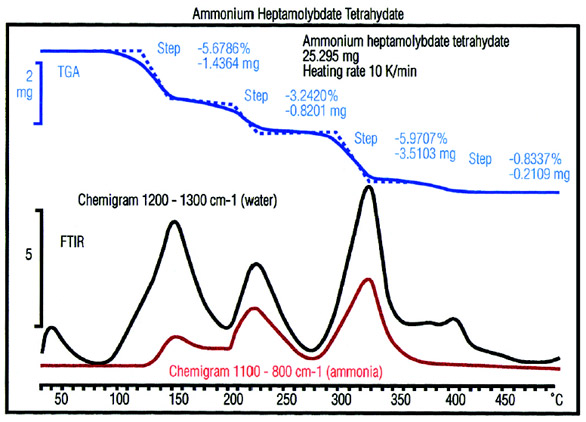
Figure 7 - (NH4)6Mo7O244H2O decomposes in three steps with the
elimination of six molecules of NH3 and seven molecules of H2O. Except
in the last weight loss step, it can be seen that water and ammonia are
formed simultaneously but not in a fixed ratio to each other. This indicates
that the decomposition is nonstoichiometric.
Conclusion
Combining a thermobalance
with a mass spectrometer or an
FTIR spectrometer opens up
many important new application
possibilities for thermogravimetric analysis. Qualitative
information on the
substances evolved can be
obtained in addition to the
quantitative results from the
weight loss steps. The on-line
combination of thermogravimetric
and spectrometric measurements
provides comprehensive details
on the processes that occur.
Mr. Basalik is Market Manager, METTLER
TOLEDO Laboratory Business Area,
1900 Polaris Pkwy., Columbus, OH 43240,
U.S.A.; tel.: 800-638-8537; fax: 614-438-4544; e-mail: [email protected].