Degradation of proteins during storage or processing is a major concern in both manufacturing
and research. A detailed structural analysis is
often not required; a simple, fast, “good/bad”
determination is needed. Fourier transform infrared spectrometry can make this discrimination, provided proper care in data collection is
taken. This paper outlines the challenges, limitations, and potential of FTIR, and gives an example involving the temperature-induced changes
in bovine serum albumin.
Protein characterization
Proteins are characterized by four levels of structure: 1) primary—the sequence of amino acids in
the peptide chain, 2) secondary—organized
regions within the peptide chain, 3) tertiary—
folding of the organized and unorganized regions,
and 4) quaternary—spatial combinations of multiple peptide chains. The amide bonds of the
amino acids in a protein are all similar, but the
molecular environment of each amino acid
residue depends upon the local structure, in particular, the secondary structure. Amino acids in
proteins participate in hydrogen bonding relationships with spatially close neighbors, forming
secondary structures such as α-helices, β-sheets,
β-turns, and random coils.
The bonds in molecules can be stimulated to vibrate
by exposure to infrared radiation. A full description of
why the secondary structure affects the IR spectrum
(in infrared and Raman spectroscopy) is available
elsewhere.1 Simply stated, the molecular environment
(such as hydrogen bonding) acts like the tuning knobs
on a guitar, changing the frequency slightly. Many
publications deal with correlating the frequencies of
amino acid vibrations to the presence of various secondary
structural elements.2 There are limitations to
this method,3 but the fact that structure affects the
spectrum has been clearly demonstrated.
The primary vibration of interest in proteins is
the amide I stretch (around 1650 cm–1), which
results from the concerted vibration
of the O=C–N amide group. The
oxygen and nitrogen both participate
in the hydrogen bonding; thus
the influence of secondary structure
on the vibration can be pronounced.
Unfortunately, both liquid and
vapor phase water also have vibrations
in this region, and the removal
of these two interferences is the
biggest challenge to the infrared
analysis of proteins.
There are several mechanisms for
avoiding the water peaks. The vapor
can be removed either through purging
the spectrometer with nitrogen or
dry air, or through digital means.
Physical removal by purging is preferred,
since any digital processing
always moves the analysis one step
further away from the raw data. The
liquid peak can be removed by using
D2O as a solvent (the deuterium
vibration is shifted away from the
amide I band), but this is both expensive
and inconvenient.
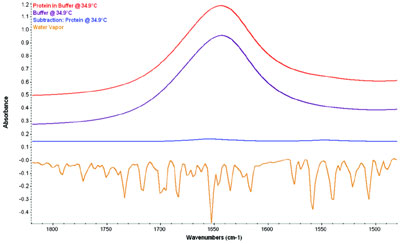
Figure 1 - Infrared spectra of BSA in solution, the buffer, the difference spectrum,
and a water vapor overlay. The first three are on a common scale, showing
the tiny protein signals relative to the original spectra. The water vapor (not to
scale) shows the extreme overlap of the vapor peaks, often misinterpreted as noise.
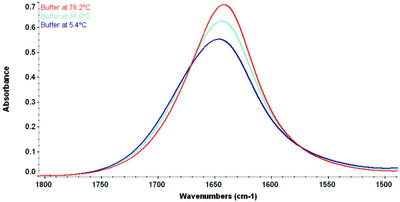
Figure 2 - Spectrum of Tris buffer as a function of temperature. Note the peak
shifts and narrows at high temperature due to the breakdown of the hydrogen bonds.
These issues are highlighted in Figures
1 and 2. Figure 1 shows the spectrum
of water vapor and the spectrum of a
protein in an aqueous buffer. Also
shown are the buffer spectrum and the
difference spectrum (protein minus
buffer), all on a common scale (offset
for clarity). The protein signal is
small—about 0.02 absorbance units
versus the 1.5 Au of the buffer peak. The overlap
of the water vapor is also apparent. Figure 2
demonstrates the effect of variable temperature on
the (liquid) water peak. Protein stability studies
often focus on the influence of temperature, but
subtraction of a buffer spectrum taken at room
temperature from a protein spectrum taken at
higher or lower temperatures will result in unusable
data because the water peak
shifts and changes shape.
Experimental
Bovine serum albumin (BSA) (Sigma Aldrich, St. Louis, MO) was diluted in
a Tris buffer (.05 M Tris, 0.05 M NaCl,
0.0005 M ethylenediaminetetraacetic
acid [EDTA], pH 7.2) to yield a 4-mg/mL solution. A Nicolet™ 6700 spectrometer (Thermo Electron Corp.,
Madison, WI) equipped with midinfrared
optics (KBr beamsplitter, deuterated
triglycine sulfate [DTGS] detector)
and its Proteus™ protein analysis kit
temperature control accessory (Thermo
Electron Corp.) were purged with dry
air overnight. The sample was contained
in a 6-μm pathlength cell with
CaF2 windows. The @Temp™ program
(Simplex Scientific, Middleton, WI) provided with
the Proteus kit was used to collect spectral data from
5 °C to 80 °C in 5 °C steps. A 5-min equilibration
time followed each temperature step. The spectra
resulted from 256 scans collected at 4 cm–1 resolution.
Data were processed and analyzed using the
OMNIC™ spectroscopy software suite (Thermo
Electron Corp.), including the Peak Resolve™ feature
available in OMNIC. Information supplied in
the guidebook4 provided with the Proteus protein
analysis kit was used to define the experiment and
analysis. The results were exported to Microsoft®
Excel™ (Microsoft, Redmond, WA) for final analysis
and presentation.
Results and discussion
Elevated temperatures cause the breakdown of
hydrogen bonds. The protein secondary structure
is held together by hydrogen bonds; thus their
loss can result in subtle or catastrophic changes
to the protein. This, in turn, leads to a loss of
protein function.
Bovine serum albumin is a transport protein for
fats and other water-insoluble materials in the
blood. No structure for BSA is presently available,
but the protein apparently has between
54% and 68% α-helix,5 with the rest turns and random coil (no β-sheet). The analogous human
origin protein (HSA) exhibits a heart-shaped 3-
D structure with at least five “slots” for transporting
fatty acids.
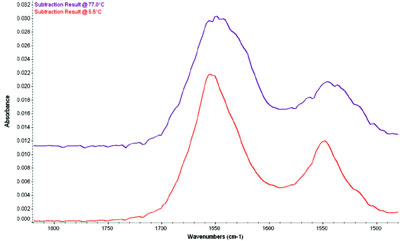
Figure 3 - BSA spectrum at low and high temperatures. The large change in the
spectrum due to degradation of the protein is clear even without further analysis.
The spectrum of BSA at low and high temperatures
is shown in Figure 3. Even without further
analysis, changes are already evident. There are
now a number of paths open to extract the
desired information. The analysis chosen will
determine whether the user requires simple qualitative
information (has the protein changed?)
or more detailed information about the secondary
structure.

Figure 4 - Curve fit results for the high-temperature data. The peak due
to α-helix makes up less than 35% of the total area (as opposed to over 60%
initially), indicating a change to the protein secondary structure.
First, spectral analysis techniques such as curve fitting
can be used to extract information about the
specific secondary structures, using correlation
tables like that in Ref. 4. This process is shown
applied to the BSA spectrum in Figure 4. The initial
fit parameters and allowed variation are chosen
using the behavior of well-characterized proteins as
reference points. The areas of the various fitted
peaks are proportional to the “concentrations” of
the helix, sheet, etc., and therefore percentages can
be calculated and tabulated.
Alternatively, the spectra may be compared to databases
of proteins with known characteristics to
assign the percentages of each secondary structural
element. A database correlating protein information
(percent α-helix, β-sheet, etc.) with infrared
spectral information is built in a chemometrics
package such as TQ Analyst (Thermo Electron
Corp.). As with any chemometrics method, the
quality of the results depends on the quality of the
input data. A wide range of secondary structures is
required, and hence the maximum variability can
be modeled. Various algorithms (such as partial
least squares) are then applied to build a calibration,
and the method is validated.
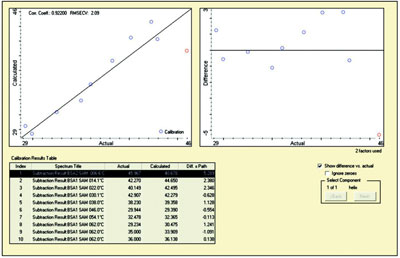
Figure 5 - Screen capture from TQ Analyst showing a “calibration” for
BSA degradation. This was done using internal validation; the 0.92 correlation
shows the method is reliable.
A simpler method can be applied to the study
of protein degradation. Here, a database
involving only the protein of interest is built,
and some target parameter, such as reactor
yield or catalytic efficacy, is measured for the
standards. Now, comparison of a spectrum to
the database directly yields a prediction of
performance. Figure 5 shows a similar application
of chemometrics to the BSA data.
Here, the percentages of α-helix were calculated
from curve fitting. This was then
entered into TQ Analyst, and a cross-validation
(1-point out) was performed. The excellent
correlation shows that the data are internally
consistent and may be useful in
predicting behavior.
Correlation tables and chemometrics profiles
for proteins must always be used with
care. Some proteins, such as the α-helix in
poly-L-lysine, behave quite differently
from most other proteins. Jackson and
Mantsch3 discuss the misuse of infrared
data and establish some boundaries for the
analysis. In short, changes are easy to
assess, but absolute conformations are generally
not.
Conclusion
FTIR has great potential for rapidly and
simply providing quality control information
about proteins in aqueous solutions. By
following a standard set of procedures, the
data can yield insights into whether processing
has altered a protein, without
requiring crystallizing or concentrating the protein.
The method of data analysis will depend upon
what type of information is desired, and may be tailored
to a specific protein. The Proteus protein
analysis kit makes the method accessible for users
unfamiliar with FTIR.
References
- Bradley, M. Thermo Electron Corp. Application Note AN 50733, “Curve Fitting in Raman and IR Spectroscopy: Basic Theory of Line Shapes and Applications”; 2004.
- Oberg, K.A.; Ruysschaert, J.-M.; Goormagtigh, E. Eur. J. Biochem.2004, 271, 2937–48.
- Jackson, M.; Mantsch, H.H. Crit.Rev. Biochem. Molec. Biol. 1995, 30(2), 95–120.
- Bradley, M.S.; Nishikida, K. Infrared Measurements of Proteins: Theory and Applications. Booklet included in Proteus protein analysis kit (not available separately), 2005.
- Grdadolnik, J.; Marechal, Y. Appl. Spectrosc. 2005, 59(11), 1347–56.
Dr. Bradley is Product Specialist, Thermo Electron Corp., 5225
Verona Rd., Madison, WI 53534, U.S.A.; tel.: 608-276-5620;
fax: 608-276-6328; e-mail: [email protected].