Photoacoustic spectroscopy (PAS) is based on the conversion of optical energy to thermal energy. When a sample gas absorbs light energy, it heats and expands, creating pressure variation in an enclosed space. When infrared radiation is emitted at a certain frequency, pressure variation in the photoacoustic sample chamber produces an acoustic wave of the same frequency. After light energy is converted into pressure variations, sound energy is detected using a microphone and is transformed into an electric signal.
The photoacoustic effect is beneficial in gas analysis because sensitivity is not dependent on absorption pathlength. This enables a short absorption path to provide high sensitivity and linear concentration response over a wide dynamic range of measurement from sample volumes as low as a few milliliters. Thus, there is potential to miniaturize the instrument to handheld size while retaining laboratory-grade performance. Direct absorption measurement, known as a zero-background technique, results in stable instruments that do not require frequent recalibration.
Applications of PAS include dissolved gas analysis, greenhouse-gas monitoring, indoor/outdoor air-pollutant monitoring, occupational safety monitoring and process control. Hydrocarbons, inorganics, volatile organic compounds (VOCs), fluorocarbons, low-level corrosives and anesthetics can be measured.
Optical cantilever microphone
In photoacoustic spectroscopy, microphone sensitivity is critical, particularly in applications like trace-gas analysis. A microelectromechanical system (MEMS) approach developed by Gasera, Ltd. (Turku, Finland) utilizes a patented, thin-silicon cantilever sensor (see Figure 1, left) that detects pressure changes in a photoacoustic cell.1 Over 100 times more sensitive than the traditional membrane, the sensor moves like a flexible door in response to pressure variations in the surrounding gas. This motion circumvents the so-called breathing effect that occurs in capacitive measurement, in which another electrode of the capacitor restricts the sensor’s movement and dynamic range. Cantilever displacement is monitored with a laser-based readout interferometer (Figure 1, right). Readout measures displacement over the sub-picometer to multi-millimeter range.
 Figure 1 – Cantilever sensor and readout interferometer.
Infrared source configurations
Different types of infrared sources can be utilized in cantilever-enhanced PAS as there are no wavelength-selective components in the system. Selection of light source depends on the gases measured and sensitivity requirements. Compatible light sources include tunable diode lasers (TDLs), broadband infrared sources connected to optical filters (nondispersive infrared [NDIR] sensing) and widely tunable mid-infrared lasers such as optical parametric oscillators (OPOs) and external cavity-quantum cascade lasers (ECQCLs)2,3 (see Figure 2).
 Figure 2 – Possible infrared source options for photoacoustic detection.
 Figure 3 – Compact, lightweight GASERA ONE photoacoustic multi-gas analyzer.
Two GASERA ONE (Gasera) photoacoustic gas analyzers (Figure 3) were used to 1) detect emissions from damaged floors and 2) monitor sulfur dioxide emissions of ships.
Detecting emissions from damaged floors
Excess moisture below floors results in chemical degradation. Indicator compounds to the damage include 2-ethyl-1-hexanol (2-EH) in older floors and C9 alcohols in newer ones. Fast, on-site analysis is required for reliable indoor air-quality assessments.
A 4-ppm reference gas sample of 2-EH compound was measured with a GASERA ONE analyzer equipped with a widely tunable OPO for calibration (see Figure 4). Amplitude modulation at 70-Hz frequency was used. The chemometric algorithm of the analyzer converts the spectrum to a concentration reading. Detection limit was determined by measuring the root-mean-square (RMS) noise from a synthetic air background (zero gas). Measured detection limit of 2-EH gas (2 × RMS) for a 1-minute measurement was 0.125 ppb, which is in the same range as conventional VOC sampling.
 Figure 4 – Measured photoacoustic headspace spectrum of a damaged floor sample. The sample emits mostly 2-EH gas, which can be observed in comparison to the measured spectrum of pure 2-EH gas.
The analyzer measured a damaged floor sample from a property with known indoor air-quality issues. Emissions from a small piece of floor were measured in headspace configuration (Figure 4). The spectral shape of 2-EH is seen clearly in the sample. Peaks between 3400 and 3415 nm and 3433 and 3455 nm are the result of water vapor in the headspace. Headspace measurement with good signal-to-noise ratio (SNR) and no interference from other emitted compounds was achieved.
Sulfur dioxide emissions monitoring
Tightened regulations for sulfur content in marine fuel have generated a need for new means of compliance monitoring. Sulfur content in ship fuel can be determined by measuring the ratio of the sulfur dioxide (SO2) and carbon dioxide (CO2) concentrations from vessel emissions. Atmospheric concentration for SO2 at sea is assumed to be zero, and CO2 concentration is typically just below 400 ppm. To reliably quantify sulfur content in fuel, a sub-ppb-level detection limit for SO2 and sub-ppm level detection limit for CO2 are required.
A continuous-wave (CW) distributed-feedback (DFB) QCL emitting in mid-infrared region was used to measure SO2, and a TDL emitting in near-infrared was chosen for CO2. Lasers were installed at each end of the photoacoustic cell and the two gas components were measured simultaneously from the same gas volume using different modulation frequencies. Wavelength modulation was used for both gas components by altering the current of the laser.
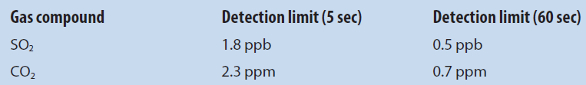
Spectral peaks of SO2 were measured in the 1340–1350 cm–1 region of the QCL with a photoacoustic configuration, and the optimal spectral peak with minimal cross-sensitivity was selected. (Cross-sensitivity is not critical in CO2 measurement because the measured atmospheric concentration is several orders of magnitude higher.) A spectral peak of 4990 cm–1 was chosen for CO2. Table 1 shows performance of the GASERA ONE analyzer using various measurement times. Detection limits of 0.5 ppb for SO2 and 0.7 ppm for CO2 were achieved using an integration time of one minute.
Table 1 – Performance of GASERA ONE analyzer for SO2 and CO2 with different integration times
Conclusion
Cantilever-enhanced photoacoustic spectroscopy is a versatile gas analysis tool that can be easily configured to detect chemical compounds in trace-gas sensing applications. Sub-ppb-level detection limits were demonstrated in measurements of indoor air quality and ship emissions.
References
- Kauppinen, J.; Wilcken, K. et al. High sensitivity in gas analysis with photoacoustic detection. Microchem. J. 2004, 76, 151–9.
- Hirschmann, C.B.; Lehtinen, J. et al. Sub-ppb detection of formaldehyde with cantilever enhanced photoacoustic spectroscopy using quantum cascade laser source. Appl. Phys. B 2013, 111, 603–10.
- Hirschmann, C.B.; Sinisalo, S. et al. Trace gas detection of benzene, toluene, p-, m- and o-xylene with a compact measurement system using cantilever enhanced photoacoustic spectros- copy and optical parametric oscillator. Vibr. Spectrosc. 2013, 68, 170–6.
The authors are with Gasera, Ltd., Tykistökatu 4D, 20520 Turku, Finland; tel.: +358 40 834 1135; e-mail: [email protected]; www.gasera.fi