Tumor metastasis, inflammation, and development are accompanied by the invasion of cells through the extracellular matrix. Invasive cells extend small localized protrusions that preferentially degrade the surrounding matrix; these protrusions are termed invadopodia in cancerous cells, and podosomes in nonmalignant cells such as macrophages.1
In order to dissect the complex interplay of factors guiding and controlling this movement, researchers apply cells to one side of a layer of gelled matrix molecules and quantify the relative number of cells that traverse the layer. While this method is extremely useful for analyzing invasion at the cell population level, analysis of the subcellular events mediating the stages of invasion require techniques with higher resolution.
One method frequently used to identify regions of the cell that initiate invasion involves plating cells on a surface coated with a thin layer of fluorescently labeled gelatin and visualizing regions where the cell has degraded the matrix, yielding an area that is devoid of fluorescence.2 Unfortunately, this process is highly laborious and dependent on user technique to create a homogeneously labeled gelatin. Furthermore, inconsistent and uneven application on glass substrates due to nonstandardized protocols can skew results.
QCM™ Gelatin Invadopodia Assay kits (EMD Millipore, Temecula, CA) enable more rapid and consistent visualization of matrix degradation produced by multiple cell types, quantification of degradation by image analysis, characterization of proteolytic time courses, and exploration of modulator effects on invadopodia formation.
The kits provide the reagents necessary for affixing thin, consistent coatings of prelabeled fluorescent gelatin (fluorescein- or Cy3-conjugated) on glass substrates and include fluorescently labeled phalloidin (tetramethyl rhodamine iso-thiocyanate [TRITC]- or fluorescein isothiocyanate [FITC]-conjugated) and 4’,6-diamidino-2- phenylindole (DAPI), for visualizing cytoskeletal F-actin and nuclei, respectively, to allow for co-localization of matrix degradation with cellular features.
Assay preparation
To facilitate attachment of fluorescent gelatin, 8-well glass chamber slides were coated with 250 μL/well of dilute poly-L-lysine in deionized water for 20 min at room temperature. Poly-L-lysine was removed and the slides were rinsed three times with phosphate-buffered saline. Dilute glutaraldehyde was then added to each well to activate the poly-L-lysine surface for further protein attachment. Following removal of the glutaraldehyde, each well was rinsed, and 200 μL of dilute gelatin, mixed at a 1:5 ratio of fluorescently labeled:unlabeled gelatin, was coated onto each well for 10 min at room temperature, followed by rinsing. All steps including, and subsequent to, fluorescent-gelatin coating were performed to protect the glass slides from photobleaching due to excessive exposure to light.
Gelatin substrates were disinfected with 500 μL/well of 70% ethanol for 30 min at room temperature. After ethanol removal and rinsing, free aldehydes were quenched by the addition of amino acid-containing growth media and incubated at room temperature for 30 min.
A range of cell types were suspended in growth medium to a concentration of 28,000 cells/mL (20,000 cells/cm2), seeded in a volume of 500 μL/well, and cultured for 8–48 hr. For some experiments, a modulator of invadopodia formation, focal adhesion kinase inhibitor II, was added simultaneously with plating.
At the desired time point after plating, growth media were removed from the chamber slides and the samples were fixed and rinsed twice with fluorescent staining buffer.
For immuno-co-localization studies, primary antibody in fluorescent staining buffer was added to each well. Samples were then rinsed in fluorescent staining buffer before proceeding to room temperature incubation with fluorescent secondary antibody, fluorescently conjugated phalloidin, and DAPI in staining buffer. Primary and secondary antibodies were omitted for stains incorporating phalloidin and DAPI only. Finally, samples were rinsed twice each with fluorescent staining buffer and Dulbecco’s phosphate-buffered saline (DPBS) before removal of culture chambers and cover-slipping. Slide-mounting media containing antifade reagent and appropriate-thickness cover glasses were selected for imaging magnification of choice.
Mounted cover glasses were allowed to hard-set before fluorescent imaging with illumination and filters appropriate for fluorescein/FITC, Cy3/TRITC, and DAPI excitation and emission wavelengths. Samples were imaged on an inverted widefield fluorescent microscope at 20× objective magnification for quantification studies (five fields of view per well) or at 63× objective magnification (oil immersion) for co-localization experiments.
Image analysis was performed utilizing free, downloadable ImageJ software distributed by the National Institutes of Health (NIH, Bethesda, MD).3 DAPI signal was thresholded for high intensities, and then analyzed as “particles” for determination of a nuclear (cell) count. Similarly, phalloidin signal was thresholded for high intensities to allow for measurement of total cell area per field of view. Conversely, fluorescent gelatin signal was thresholded for low intensities to enable quantification of total degradation area per field of view.
Matrix degradation
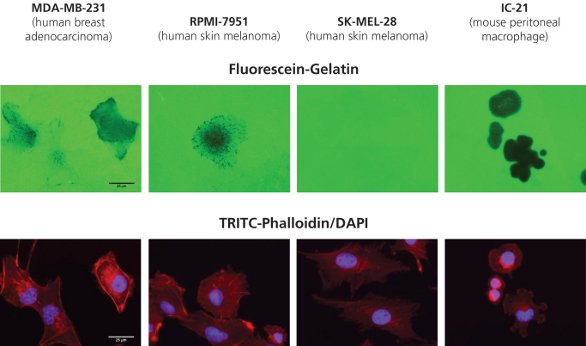
Figure 1 - Fluorescein-gelatin matrices (top row) were coated onto 8-well glass chamber slides as described, and multiple human cancer cell lines were plated on top. F-actin and nuclei were stained, respectively, with TRITC-phalloidin (bottom panel, red) and DAPI (bottom panel, blue). Cells were imaged at 63× objective magnification (bar = 25 μm).
Figure 1 depicts the degradation observed with four cell lines: human breast adenocarcinoma (MDA-MB-231), human skin melanoma (RPMI-7951 and SK-MEL-28), and mouse peritoneal macrophages (IC-21) plated onto fluorescein (green)-conjugated gelatin substrates at 20,000 cells/cm2 for 24 hr. F-actin and nuclei were stained, respectively, with TRITC-phalloidin (bottom panel, red) and DAPI (bottom panel, blue).
As expected, SK-MEL-28 cells, a noninvasive melanoma type, do not display gelatin degradation. The MDAMB- 231, RPMI-7951, and IC-21 cells showed a range of matrix degradation patterns including punctate, linear, or blotchy areas devoid of fluorescein-gelatin fluorescence. Not all cells in a population will exhibit proteolytic behavior, and cellular movement between sites of degradation may be observed.
Co-localization studies
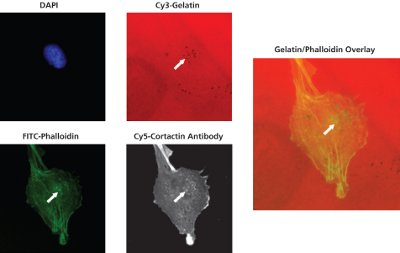
Figure 2 - Co-localization of degradation with invadopodia-related puncta. RPMI-7951 human skin melanoma cells were seeded onto Cy3-gelatin substrates for 24 hr. White arrows in the gelatin, phalloidin, cortactin, and overlay images demonstrate an example of co-localization between matrix degradation, F-actin puncta, and cortactin foci.
As shown in Figure 2, RPMI-7951 skin melanoma cells seeded onto Cy3 (red)- gelatin matrices demonstrate the ability of the kit to co-localize sites of gelatin degradation with phalloidin (F-actin) puncta and cortactin foci.
Cells were incubated with a primary antibody against cortactin, followed by detection with a Cy5-conjugated secondary antibody. Secondary antibody incubation was performed concurrently with FITC-phalloidin and DAPI staining, as detailed.
Cortactin protein is strongly associated with actin assembly, and co-localization of this molecule with areas of proteolysis is indicative of dynamically “active” invadopodia formation. White arrows in the gelatin, phalloidin, cortactin, and overlay images demonstrate an example of colocalization between matrix degradation, F-actin puncta, and cortactin foci.
Degradation time courses
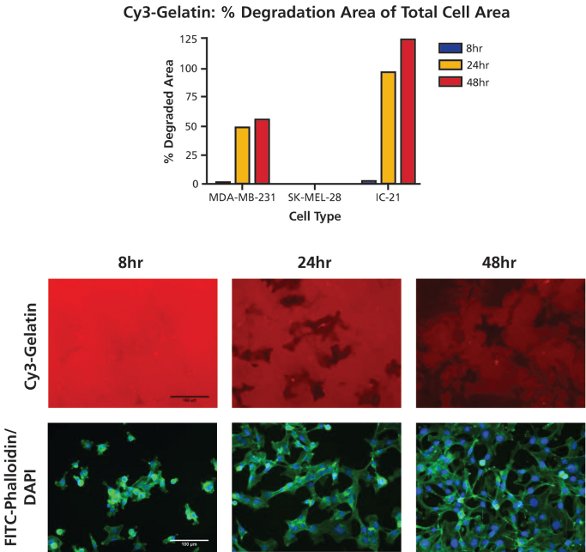
Figure 3 - Time-course of gelatin degradation. MDA-MB-231 cells were plated onto Cy3-gelatin substrates (top image panel, red) and cultured for 8, 24, or 48 hr. Following staining with FITC-phalloidin (bottom image panel, green) and DAPI (bottom image panel, blue) cells were imaged at 20× objective magnification at five fields of view per well. Percent degradation area of total cell area was quantified using ImageJ analysis software. Bar = 100 µm.
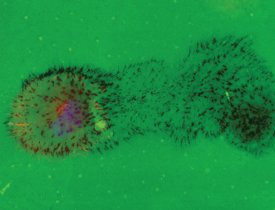
Figure 4 - Areas devoid of fluorescence demonstrate the motility of certain cell types during the proteolytic process, leaving a trail of degradation as they migrate.
Cells were analyzed utilizing ImageJ software to obtain the percent degradation area of total cell area data depicted in Figure 3. For MDA-MB-231 and IC-21 cells, degradation percentage increased over time, with the most significant augmentation in proteolysis occurring between the 8-hr and 24-hr time points. No degradation by noninvasive SK-MEL-28 cells was observed at any time point. Of note is that although the theoretical maximum of percent degradation area of total cell area is 100%, higher amounts of degradation were observed, likely due to cellular movement during proteolysis. Such historical degradation is recorded using this assay, resulting in degradation areas larger than the area of a cell itself (particularly for longer time points or highly motile cell types).
Figure 4 demonstrates the motility of certain cell types as they leave a trail of matrix degradation during the proteolytic process. In this example, RPMI-7951 human skin melanoma cells were cultured for 24 hr on fluorescein-conjugated gelatin (green) coated onto glass chamber slides. F-actin and nuclei were stained with TRITC-phalloidin (red) and DAPI (blue), respectively.
Modulation of degradation
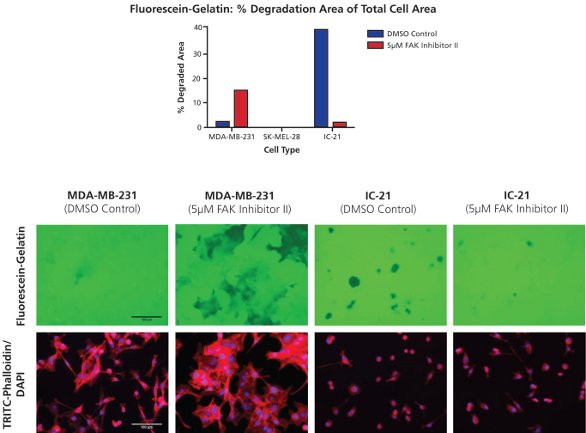
Figure 5 - Modulation of gelatin degradation by a focal adhesion kinase inhibitor. Fluorescein-gelatin matrices (top image panel, green) were seeded with cells and simultaneously treated with 5 µM FAK inhibitor II or a 0.4% DMSO control. Following 24-hr treatment, cells were fixed and stained for F-actin and nuclei with TRITC-phalloidin (bottom image panel, red) and DAPI (bottom image panel, blue). Samples were imaged at 20× objective magnification at five fields of view per well. Bar = 100 µm.
Cells were seeded onto fluorescein-gelatin matrices and treated with focal adhesion kinase (FAK) inhibitor II or a dimethyl sulfoxide (DMSO) control (Figure 5). FAK inhibition, which has previously been shown to enhance invadopodia formation in certain cell types,4 was observed to increase MDA-MB-231 degradation over the course of 24-hr treatment. The noninvasive phenotype of SK-MEL-28 cells was not altered by addition of FAK inhibitor II. Surprisingly, IC-21 degradation was decreased by treatment with the compound. Such opposite effects as those seen between the MDA-MB-231 and IC-21 cells emphasize variations in proteolytic behavior between cell types, and may be due to differences in degradation signaling pathways between cell types in general, or between cancerous (e.g., MDA-MB-231) and normal (e.g., IC-21) cell phenotypes.
Conclusion
The data presented here demonstrate a new approach to the visualization and quantification of gelatin degradation by a variety of cell types at multiple time points and following treatment with modulators of invadopodia formation. Such assays provide a convenient, flexible system for monitoring matrix degradation and investigating key components of the proteolytic process, both at the single-cell and subcellular levels.
References
- Ayala, I.; Baldassarre, M. et al. Invadopodia: a guided tour. Eur. J. Cell Biol.2006, 85, 159–64.
- Chen, W.T.; Olden, K. et al. Expression of transformation-associated protease(s) that degrade fibronectin at cell contact sites. J. Cell Biol.1984, 98, 1546–55.
- Rasband, W.S. ImageJ, U.S. National Institutes of Health, 1997–2011, Bethesda, MD; http://imagej.nih.gov/ij/
- Liu, S.; Yamashita, H. et al. Laminin-332-β1 integrin interactions negatively regulate invadopodia. J. Cell Physiol. 2010, 223, 134–42.
Ms. Anderl is R&D Research Scientist for Cell Based Assay Development, Dr. Armstrong is Senior R&D Manager for Cell Based Assay Development, and Mr. Ma is Product Manager, EMD Millipore, 28820 Single Oak Dr., Temecula, CA 92590, U.S.A.; tel.: 951-514-4293; fax: 951- 699-8324; e-mail: [email protected].