The development of solid-state acoustic viscometers opens a wide range of new applications in both the laboratory and the field. For example, on-line, realtime viscosity measurement can be important in applications as varied as monitoring the transmission fluid in a Huey helicopter exposed to the extremes of desert warfare and controlling the consistency of the newest shade of lipstick.
Although solid-state viscometers have only been commercially available for a short time, extensive laboratory testing has confirmed their accuracy against mineral oil standards. A number of Fortune 500 companies have already qualified these sensors for incorporation into their laboratory protocols as well as into the systems they manufacture or use. These sensors are also being used in hospitals to measure changes in the viscosity of blood to provide an early indication of a potential heart attack by helping to identify a specific protein in a sample as small as a pinprick. They also play a critical role in measuring the viscosity of nanoscale fluids in university laboratories. They can signal changes in molecular weight and molecular weight distribution during polymer synthesis. Additionally, the sensors can be used in the pharmaceutical and cosmetic industries to measure the viscosity of creams, pastes, and gels.
Measuring the viscosity of peanut butter
Measuring and maintaining the proper level of viscosity is important in the food processing industry, where controlling the consistency of products as diverse as chocolate, yogurt, tomato paste, and peanut butter is critical. This can be a challenge; for example, a conventional rotary viscometer equipped with a spiral adapter to continuously pump the sample until it reaches a steady state of flow can be used to measure the viscosity of peanut butter in the laboratory, but cleaning the threaded spindle and concentric outer cylinder between tests can be sticky, messy, and time consuming. Solid-state sensors eliminate this problem. Cleanup between tests is simply a matter of wiping the face of the sensor.
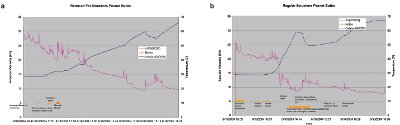
Figure 1 a) Acoustic viscosity of reduced-fat peanut butter. b) Acoustic viscosity of regular peanut butter.
In this particular case, the laboratory test was designed to compare the effect of temperature change on samples of reduced-fat and regular peanut butter. As can be seen in Figure 1, the viscosity, i.e., consistency, of both the reduced-fat and regular peanut butter decreased sharply as the temperature rose. This test was designed to determine the suitability of acoustic sensors in closing the information loop between in-process control monitoring and outgoing product quality.
A clear picture
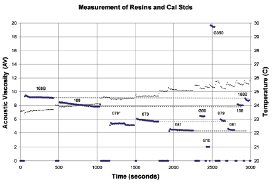
Figure 2 - Viscosity of each of the four samples and three mineral oil standards (G10, G60, and G350).
A manufacturer of plastic resin optical disks used a solid-state acoustic sensor to measure the viscosity of four plastic precursor resins identified as 079, 081, 168, and 168B by the manufacturer. The laboratory tests used mineral oil standards. They demonstrated that the acoustic sensor reliably and accurately measured the viscosity of the four resins while providing baseline data for quality control (Figure 2).
Oil conditioning
Dust, mud, boiling heat, freezing cold, and round-the-clock operation can degrade lubricants; cause premature mechanical failure; and shorten the life of diesel, gasoline, and alternatively fueled engines, whether used on- or off-highway or in stationary equipment. A major OEM in the diesel asset market conducted performance qualification tests using a variety of motor oils. The viscosity for these oils was previously measured at the customer’s laboratory for the following temperatures: 40 °C, 50 °C, 60 °C, 70 °C, 80 °C, 90 °C, and 100 °C. These measurements are the reference measurements against which results from a solid-state viscometer were compared.
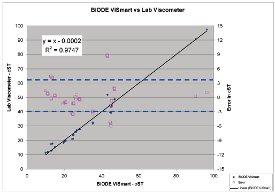
Figure 3 - Correlation of laboratory and solid-state viscometer measurements.
Samples of 200 mL were weighed to get an idea of the relative difference of densities between the oils. The results showed less than 3% of difference. The tests demonstrated an extremely strong correlation between the laboratory measurements and the data obtained from the solid-state viscometer across all the oils under consideration (see Figure 3).
The tests revealed that solid-state sensors, embedded in crankcases, transmissions, and hydraulic reservoirs, can be used to inform the driver or pilot of changes in fluid viscosity that can signal oxidation, thermal degradation, or contamination from water, solvents, or fuel. They can also help answer the question of when best to drain oil or change fluids. Maintenance programs based on typical, average, or normal operation are, at best—even when supported by laboratory tests—educated guesses. Knowing on a unit-by-unit basis when oils or fluids are beginning to break down and need to be changed can provide a greater margin of safety than the typical preventive maintenance schedule. Because changing the oil in an 18-wheeler can cost as much as $200, the cost difference between oil drains at 15,000 and 60,000 miles is significant.
In the pipeline
One interesting application for acoustic sensors that is being pursued actively can be found in the oil pipeline industry. These sensors have been tested at the University of Tulsa (OK) and are currently being used to improve operational efficiency in a major oil company pipeline serving the New England states. By introducing high-polymer drag reducers into the pipeline stream, the operator was able to significantly lower costs, since frictional losses within centrifugal pumps can result in high energy costs representing as much as 50% of total pipeline operating costs. However, hydrocarbon viscosity is difficult to measure because it is dependent on temperature and shear rate, variables that constantly change mile by mile, as product flows through the pipeline. By embedding acoustic sensors at regular intervals along the pipeline, pipeline operators are able to control the viscosity of crude and other petroleum products, significantly reducing operating costs.
The primary goal of the initial testing program was to compare the solid-state viscometer to existing ASTM methods. The test fluid selected is physically stable, Newtonian, immiscible with water, easily discernible in acrylic pipe, environmentally safe, and reasonable in cost. An important characteristic of the oil is its large range of viscosity due to strong temperature dependence.
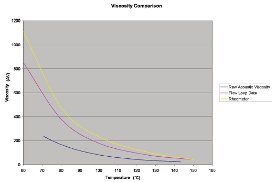
Figure 4 - Viscosity and temperature performance data for solid-state viscometer.
To test the solid-state viscometer, a sample was placed in an environmental chamber and heated to approximately 50 °C. Acoustic viscosity and temperature were logged as the sample cooled to room temperature (Figure 4).
Additional research is planned to determine the potential of solid-state acoustic sensors in providing data relating to wax depletion rates, interface detection in pipelines carrying a product mix, viscosity of emulsions, gas entrainment fractions, and down-hold monitoring.
Conclusion
As the above examples show, the benefits of solidstate viscometer technology include the ability to measure very small sample amounts; easier use with no mechanical spindles to change or clean; and the ability to bring laboratory-grade instrumentation into the field, integrating it into process control systems and allowing laboratory, production, and quality control personnel to better match results by using the same instruments.
Mr. Durdag is CEO, BiODE, Inc., 100 Larrabee Rd., Westbrook, ME 04092, U.S.A.; tel.: 207-856-6977; fax: 207-856-6864; e-mail: [email protected] .
*Part one of this article (https://www.americanlaboratory.com/914-Application-Notes/35740-Measuring-Viscosity-in-Samples-as-Small-as-100-Microliters-Part-1/) (Am. Lab. News 2006, 38[21], 14) described the acoustic wave technology employed in solid-state viscosity sensors. Part two illustrates some of the applications for which this technology is applicable.