UV/VIS spectrophotometry is a valuable tool for measuring the properties of liquids and solids. One of the most common applications in QA/QC environments is color analysis and the ability to assign a color value to finished products. The color value of a material can be obtained by collecting a % transmittance or reflectance spectrum of the sample under consideration.
Spectrophotometers with a large photometric range are ideal for making accurate color measurements, as dilution is not required for highly absorbing samples such as maple syrup. Samples can be analyzed neat without further dilution. This article illustrates the use of color analysis software and a UV-2600 UV/VIS spectrophotometer from Shimadzu (Kyoto, Japan) with a photometric range of 5 abs. units for quick and easy spectral acquisition and interpretation into a meaningful color value.
Background
Maple syrup is one of the most commonly used sweeteners produced in the U.S.A. and Canada. It is graded primarily by color, which changes with the time of year that sap is collected. In general, the later it is collected, the darker the syrup.
Until recently, the U.S. had three categories of Grade A syrup, referred to as Light, Medium and Dark Amber. Vermont also has a grade referred to as “Fancy,” which was reported to be lighter in color than the three U.S. Grade A classifications. An additional classification is Grade B, which is darker than Grade A Dark Amber and is considered unsuitable for consumer labeling by some vendors. However, consumers have sought ways to purchase the Grade B syrup because of its sweeter taste, leading some manufacturers to label it for sale.
The United States Department of Agriculture is now providing a universal classification grading system, which was released and made active for consumers in 2015. The new system has removed the Grade B classification and classifies maple syrup as Golden Color, Amber Color, Dark Color and Very Dark Color.
U.S. grading classifications are made by comparing the maple syrup to color-glass standards. In addition to the U.S. grade standards, some states use a spectroscopic method to determine the color of maple syrup. This spectroscopic method differentiates maple syrup grades by the % transmittance (%T) at a wavelength of 560 nm. Table 1 outlines the classifications of maple syrup both at a state and federal level, along with the new rating program as of 2015.1
Table 1 – Federal and state classifications of maple syrup1

Color is a complex quality and may be more accurately interpreted by the concept of color scales rather than the %T value at a single wavelength. Multiple color scales are used in various laboratory settings, depending on the user’s protocol. One commonly used color scale is CIE L*a*b* (see Figure 1). In this scale, color values are calculated from a mathematical combination of %T. L* out of the CIE L*a*b* color scale measures the lightness of a sample. An L* value of 100 represents the maximum brightness of a color, whereas an L* value of 0 represents the minimum brightness of a color. a* measures the red or green components of a given sample. Positive values of a* represent a more red color component, whereas negative values lean more toward a dominant green component. Similarly, the b* value measures the yellow or blue components of a sample. Positive values of b* represent a stronger yellow, whereas negative values represent more blue in the sample.2
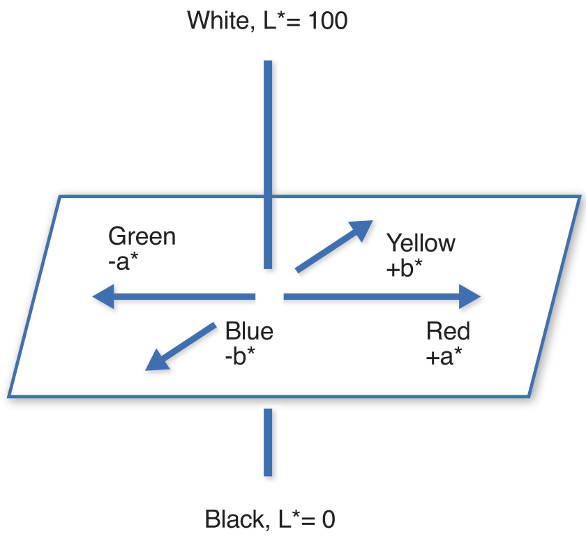 Figure 1 – Representation of the CIE L*a*b* color space.
Experimental
Four separate samples labeled as “Vermont Fancy,” “Grade A Medium Amber,” “Grade A Dark Amber” and “Grade B” were received as is from a maple syrup sampling kit. Transmittance spectra were collected using standard 10-mm quartz cuvettes with an empty cuvette as a reference with no additional sample preparation. Along with the four samples obtained from the kit, 10 commercial samples from different parts of the U.S. were analyzed.
Results and discussion
Spectra of the four different pure maple syrup samples are shown in Figure 2, with corresponding CIE L*a*b* values and the %T at 560 nm presented in Table 2. The transmittance spectra are similar in profile and demonstrate a decrease in magnitude going from the lighter Vermont Fancy to darker Grade B.
 Figure 2 – Transmittance spectra of maple syrup samples from sampling kit.
Table 2 – CIE L*a*b* values and %T (560 nm) for samples from sampling kit measured on the Shimadzu UV-2600
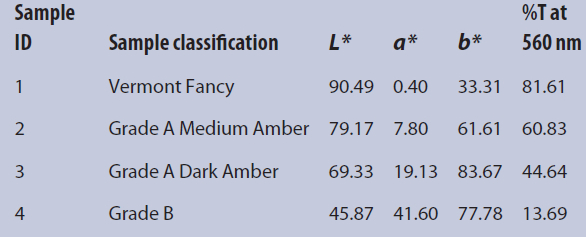
As shown in Table 2, the %T at 560 nm decreases as the samples become darker. This trend is in agreement as supported by the decreasing L* values obtained, which indicate lightness. However, this alone does not offer insight into the color of the sample.
Under the new classification system, terms such as “Golden,” “Amber” and “Dark” are used to name the maple syrup. By visually inspecting the samples, the colors range from light yellow to a reddish brown between Vermont Fancy and Grade B. As previously discussed, positive a* values indicate a more red component in the overall color determination, along with a positive b* value, which corresponds with a more yellow sample. “Amber” is a yellowish-orange color halfway between yellow and orange on the color wheel. Thus, the values for a* and b* increase, going from Vermont Fancy to Medium Amber and Dark Amber, as expected.
As shown in Table 2, the value of b* for Grade B drops slightly as compared to Dark Amber, but rises significantly for a* from 19.13 to 41.60. This is to be expected after visual inspection of Grade B since it is a dark color with a very intense red component, and less of a yellow component. This additional insight into the colors present in the maple syrup is gained through the use of color analysis software.
In addition to the samples analyzed from the sampling kit, 10 separate commercial samples labeled as “Pure Maple Syrup” with various classification grades were analyzed. Table 3 summarizes the results obtained for analyzing these products.
Table 3 – CIE L*a*b* values and %T (560 nm) for samples from sampling kit, along with commercial samples measured on the Shimadzu UV-2600

Although the %T values are reported in Table 3, it is important to keep in mind that the majority of these samples were classified under the U.S. grading system. The U.S. system does not rely on %T for classifying maple syrup, but rather on the color of the sample as compared to glass standards, a fact which suggests the importance of spectrophotometric color analysis.1
The color results obtained for the commercial samples demonstrate that, as the syrup becomes darker, the lightness value decreases. In addition to the lightness value, L*, it is observed that as the amber color darkens, the red component increases and the yellow component decreases. Thus, a more complete picture of the color of the sample is established for each material.
Interestingly, sample #6, which is classified as “Grade A Medium Amber” on the packaged bottle, demonstrated transmittance and color values close to that of a Dark Amber maple syrup. More specifically, the color values and %T are similar to samples 3 and 7–13. Visually comparing the samples, #6 has the appearance of a color closer to that of Dark Amber, rather than Medium. The transmittance spectrum of sample #6 is shown in Figure 3, overlaid with the spectra from the sampling kit in Figure 2.
 Figure 3 – Transmittance spectra of maple syrup samples, including a transmittance spectrum of commercial sample #6.
Conclusion
A UV/VIS spectrophotometer incorporating color analysis software is an accurate way to obtain a meaningful color value for maple syrup. The software and spectrophotometer together offer an effective solution for the QA/QC laboratory that requires analysis of finished products.
References
- United States Standards of Maple Sirup. Fed. Reg. May 7, 2014, 79(88).
- Hunter, R.S. and Harold, R.W. The Measurement of Appearance, second edition, John Wiley & Sons: New York, NY, 1987.
Jeff Head, M.S.; John Kinyanjui, Ph.D.; Mark Talbott, Ph.D.; and Robert Clifford, Ph.D., are with Shimadzu Scientific Instruments, 7102 Riverwood Dr., Columbia, Md. 21046, U.S.A.; tel.: 410-381-1227; e-mail: [email protected]; www.ssi.shimadzu.com