Proteins are modified in residues of lysine, arginine, histidine, etc., due to high concentrations of sugar and fatty acids in the bloodstream in relation to diabetes. This modification occurs because of the presence of reactive –NH2 groups in the above amino acids of a protein molecule. The carboxymethyllysine produced,1 in the case of lysine modification, has been used as a marker of diabetic intensity. Ongoing research seeks to understand the complications in diabetes that result from glycoxidative and lipoperoxidation modifications in protein.2,3
Few studies have focused on similar modification of DNA/RNA bases under diabetic conditions. Structurally, DNA/RNA molecules contain –NH2 groups like lysine, and histidine amino acids, which are present in protein molecules. Reactions involving adenosine present in RNA may also alter RNA functions as a possible consequence of higher levels of sugars in diabetes.
The purpose of this study was to investigate the glycoxidative modification of adenosine with reactive carbohydrates and detection of carboxymethyl-adenosine (CMAd) from the urine samples of obese diabetic and nondiabetic subjects.
Experimental
Study population
The study comprised 48 male and female participants over the age of 18; of these, 20 were healthy (control group), 14 were nondiabetic obese and 14 had type 2 diabetes. Individuals with no background of diabetes, cardiac, respiratory or renal disease and with normal fasting plasma glucose were included in the control group. All participants were recruited through the Regional Medical Center in Orangeburg, S.C. and submitted an informed consent form. The study protocol was approved by the Institutional Review Board of South Carolina State University and the Regional Medical Center.
Clinical and biochemical measurements
Body weight and height were measured to the nearest 0.1 kg and 0.1 cm, respectively, with the subjects wearing light clothes and shoeless. Body mass index (BMI), calculated as the weight in kilograms divided by the square of the height in meters, was used as an index of obesity.
Fasting blood and urine samples were collected from the subjects. Blood samples were obtained for the measurements of glucose and glycated hemoglobinA1c (HbA1c). Blood glucose levels (BGL) and HbA1c were measured at the outpatient laboratory; BGLs were assessed using fasting blood samples obtained through venipuncture. HbA1c levels were measured turbidimetrically. Fasting urine samples were obtained from volunteer donors and frozen at –20 °C until use.
Chemicals and methods
All chemicals were obtained from Fisher Scientific (Pittsburgh, Penn.) unless otherwise indicated.
1) Incubations of adenosine (A) with D-glucose and D-ribose: A mixture of adenosine (2.67 mg; 0.01 mmol) and D-glucose (1.8 mg; 0.01 mmol) was incubated in 0.2 M phosphate buffer (1 mL, pH 7.4) (with two drops of toluene added to prevent fungal growth) at 37 °C for 30 days. The reaction mixture was kept constant at pH 7.4 during the incubation period by adjusting the pH as required; 100-μL samples were collected at 2, 4, 6, 8, 10, 20 and 30 days during the incubation period and stored in the refrigerator before analysis. For analysis, a typical sample was adjusted to pH 7.0 and dried (<60 °C) in a rotary evaporator. Methanol (3 mL) was added to the dried residue; the mixture was sonicated, vortexed and centrifuged; and the methanol fraction was collected. The sample was then subjected to HPLC and LC/MS-ESI (electrospray) (Figure 1a).
 Figure 1 – LC-MS/MS-ESI (TIC [total ion chromatograms] and ion plots) spectrum of adenosine with a) D-glucose, b) D-ribose and c) chloroacetic acid.
In a separate experiment, similar incubations of adenosine (2.67 mg; 0.01 mmol) with D-ribose (1.5 mg; 0.01 mmol) were carried out in 0.2 M Pi (phosphate buffer) (1 mL), pH 7.4, at 37 °C for 30 days. The methanol extracts were subjected to HPLC and LC/MS (Figure 1b).
2) Synthesis of CMAd using adenosine (A) and chloroacetic acid: A mixture of adenosine (2.67 mg; 0.01 mmol) and chloroacetic acid (0.9 mg; 0.01 mmol) in 0.2 M Pi (1 mL), pH 7.4, at 37 °C, was incubated for 7 days. The pH was adjusted to 7.0, the mixture was dried and the methanol extracts were subjected to HPLC and LC/MS (Figure 1c) as in experiment 1.
3) Identification of CMAd in urine sample: In a typical experiment, 1 mL of fasting urine sample was adjusted to pH 7.0, evaporated in a rotary evaporator and extracted three times with methanol. The residue was analyzed by HPLC and LC/MS (Figures 2b and 3b) as in experiment 1.
 Figure 2 – LC/MS spectrum using multiple reaction monitoring (MRM) spectrometric analysis of a) CMAd, b) CMAd in fasting human urine sample and c) CMAd and urine mixing experiment.
 Figure 3 – LC/MS spectrum using MRM spectrometric analysis of a) CMAd, b) CMAd in fasting human urine sample and c) CMAd and urine mixing experiment.
Instrumentation
HPLC analysis
An HPLC system from Shimadzu Scientific Instruments (Columbia, Md.) included the LC-20AT low-pressure gradient pump with DGU-20A5 on-line degasser; SIL-20AC autosampler; Hypercarb 5-μm, 150 × 4.6 mm reversed-phase column; Hypercarb 5-μm, 10 × 4 mm guard column attached to the column head; CTO-20A column oven; and CBM- 20Alite system controller. The SPD-20AV UV/VIS detector operating at a wavelength of 254 nm was used.
For HPLC analysis, a solvent mixture of water and acetonitrile using gradient analysis consisted of 100% water (Solvent A) and 100% acetonitrile (Solvent B). The flow rate was 1 mL/min.
LC/MS and triple quadrupole mass spectrometry (electrospray, MS/MS multiple reaction monitoring method) were used for detection and identification of the CMAd from synthetic and urine sample specimens.
The Neptune hydrophilic interaction liquid chromatography (HILIC) silica LC column was 2.1 mm × 15 cm and contained 5-μm particles (ES Industries, West Berlin, N.J.). Samples were dissolved in 85% acetonitrile/15% water, and analysis was via LC/MS using HILIC. Separation was done using a binary solvent gradient as Solvent A: HPLC-grade water with 0.1% formic acid, and Solvent B: HPLC-grade acetonitrile with 0.1% formic acid.
The Micromass Q-Tof quadrupole time-of-flight mass spectrometer from Waters (Milford, Mass.) performed full-scan mass spectral analysis. LC/ MS/MS was done on the Waters Quattro Premier XE triple quadrupole mass spectrometer. The ionization method was positive ion electrospray.
Statistical analysis
Statistical Analysis System software (SAS, Cary, N.C.) analyzed the clinical parameters data, i.e., BMI, fasting BGL and HbA1c, for the three groups in the study.4 The subjects were divided into three groups—control, obese and diabetic. Descriptive statistical analyses were performed on each clinical parameter to obtain descriptive statistics such as mean, median and standard deviation (SD), as well as minimum and maximum values for the three groups. The General Linear Model test applied analysis of variance (ANOVA) followed by the adjusted Tukey’s test as a post hoc test. The F-test was used to prove the null hypothesis that there was no significant difference among the three groups, while the Tukey’s test compared each clinical parameter between the two groups. Results were tested at .05, .01 and .001 levels of significance.
Results
Table 1 illustrates the results of the ANOVA and Tukey’s tests on BMI, fasting BGL and HbA1c using mean ±SD. The symbols *, ** and †† indicate the differences among the groups and their levels of significance.
Table 1 – Clinical and biochemical characteristics of the study population: Comparison of control, obese and diabetic groups
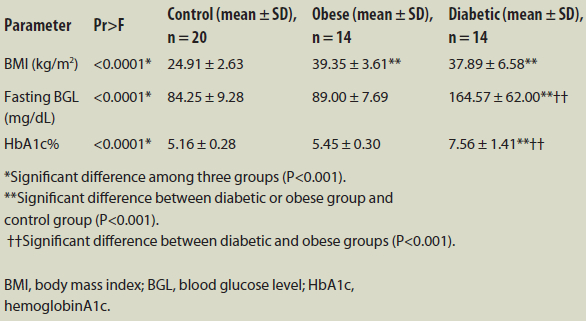
The results of ANOVA (Pr>F) indicate that the mean values of BMI, BGL and HbA1c differed significantly among the three study groups (P<0.001). A pairwise comparison revealed that BMI levels were much higher in the diabetic group (37.89 ± 6.58 kg/m2) and obese group (39.35 ± 3.61 kg/m2) than in the control group (24.91 ± 2.63 kg/m2; P<0.001). In addition, there were statistically significant elevations of BGL and HbA1c in the diabetic group compared to the control group (P<0.001). BGL and HbA1c were considerably higher in the diabetic group than in the obese group (P<0.001).
Incubations of adenosine (A) with D-glucose and D-ribose in separate experiments under physiological conditions of temperature (37 °C), pH 7.4, resulted in the formation of CMAd identified by LC/MS-ESI (Figure 1a and Figure 1b). The identity of CMAd was confirmed by its synthesis from adenosine and chloroacetic acid (Figure 1c).
Detection of CMAd in the urine samples of obese diabetic and nondiabetic subjects was done by HPLC and LC/MS analysis of the methanol extracts of the neutral pH adjusted, dried samples (Figures 2b and 3b). The ion M+H+ 326 (CMAd) verified the presence of CMAd in the samples examined. The presence of CMAd in diabetic and obese urine samples was confirmed by carrying out mixing experiments with synthesized CMAd (Figures 2c and 3c).
The boxplot charts in Figure 4 compare the three study groups for each clinical parameter (BMI, BGL and HbA1c). The first graph shows that the BMI values for all subjects in the control group were lower than those in the obese and diabetic groups. Though average BMI was slightly higher in the obese group than in the diabetic group, BMI values were elevated in the diabetic group (30 kg/m2–53 kg/m2). The graphs of BGL and HbA1c show that the averages and variations in BGL and HbA1c were much higher in the diabetic group than in the control and obese groups. The HbA1c values for all subjects in the control group were less than those in the diabetic group.
 Figure 4 – Distribution of BMI, fasting BGL and HbA1c in the three study groups.
The reaction scheme for the detection of CMAd from glycoxidation reaction and fasting human urine sample is shown in Figure 5.
 Figure 5 – Reaction scheme for the detection of CMAd from glycoxidation reactions and fasting human urine sample.
Discussion
Important biomarkers of protein modification1,5,6 in diabetes have been widely used. Although there is a sizeable body of work7-13 on protein damage, information on the effects of carbohydrate and lipid chemistry on DNA and RNA is limited.
The authors’ previous work involved the detection of carboxymethyl-2’- deoxyadenosine (CMdA) and carboxymethyl-2’-deoxycytidine (CMdC) from in vitro glycoxidation reactions, fasting urine specimens, calf thymus and human serum DNA of diabetic persons.14,15 More recent studies demonstrate that CMdA and CMdC can be used as an indicator for diabetes in obese persons.16,17 These findings led the researchers to believe that DNA molecules are also modified by glycoxidation reactions. Similar modification in RNA nucleoside adenosine is a possibility.
The identity of the CMAd compound from glycoxidative reactions of adenosine with D-glucose and D-ribose was investigated using HPLC and LC/MS-ESI (Figures 1a and b). The identity of the CMAd compound was confirmed by synthesizing CMAd using adenosine and chloroacetic acid raw materials (Figure 1c). CMAd compound was identified in both diabetic and nondiabetic obese urine samples by HPLC, LC/MS and triple quadrupole mass spectrometry (MS-MS) using the M+H+ 326 ion as a criterion for detection in mass spectrometry analysis (Figures 2b and 3b). The presence of the glycoxidatively produced and in vitro-identified carboxymethyl derivative (CMAd) in urine samples from human subjects was confirmed by HPLC and LC/MS-ESI.
CMAd was identified in the mixing experiment with synthesized CMAd and fasting human urine sample using HPLC and LC/MS-ESI (Figures 2c and 3c). These experiments proved that CMAd is produced in human systems. The authors first reported that CMAd was present in fasting urine samples from both diabetic and nondiabetic obese persons.18 The results of these experiments indicate the biological relevance of the above RNA derivatives, suggesting that glycation reactions are a possible source of complications in diabetes involving RNA macromolecules.
References
- Ahmed, M.U.; Thorpe, S.R. et al. Identification of NE-carboxymethyllysine as a degradation product of fructoselysine in glycated proteins. J. Biol. Chem. 1986, 261, 4889–94.
- Baynes, J.W. Role of oxidative stress in development of complications in diabetes. Diabetes 1991, 40, 405–12.
- Ahmed, M.U.; Dunn, J.A. et al. Oxidative degradation of glucose adducts to protein. Formation of 3-(N epsilon-lysino)-lactic acid from model compounds and glycated proteins. J. Biol. Chem. 1988, 263, 8816–21.
- SAS for Windows. Version 9.2. SAS Institute Inc., Cary, N.C.
- Januszewski, A.S.; Alderson, N.L. et al. Role of lipids in chemical modification of proteins and development of complications in diabetes. Biochem. Soc. Trans. 2003, 31, 1413–16.
- Rodríguez-García, J.; Requena, J.R. et al. Increased concentrations of serum pentosidine in rheumatoid arthritis. Clin. Chem. 1998, 44(2), 250–5.
- Thorpe, S.R. and Baynes, J.W. Role of the Maillard reaction in diabetes mellitus and diseases of aging. Drugs & Aging 1996, 9, 69–77.
- Yan, S.D.; Wautier, J.L. et al. Cellular receptors for advanced glycation end products. Implications for induction of oxidant stress and cellular dysfunction in the pathogensis of vascular lesions. Arterioscler Thromb. 1994, 14, 1521–8.
- Vlassara, H. Recent progress on the biologic and clinical significance of advanced glycosylation end products. J. Lab. Clin. Med. 1994, 124, 19–30.
- Bucala, R. and Cerami, A. Advanced glycosylation: chemistry, biology, and implications for diabetes and aging. Adv. Pharmacol. 1992, 23, 1–34.
- Onorato, J.M.; Jenkins, A.J. et al. Pyridoxamine, an inhibitor of advanced glycation reactions, also inhibits advanced lipoxidation reactions. Mechanism of action of pyridoxamine. J. Biol. Chem. 2000, 275, 21,177–84.
- Anderson, N.L.; Chachich, M.E. et al. The AGE inhibitor pyridoxamine inhibits lipemia and development of renal and vascular disease in Zucker obese rats. Kidney Int. 2003, 63, 2123–33.
- Requena, J.R. and Baynes, J.W. Studies in Animal Models on the Role of Glycation and Advanced Glycation End Products (AGEs) in the Pathogenisis of Diabetic Complications: Pitfalls and Limitations. Sima, A.F., ed. Harwood Academic Publishers: Amsterdam, 2000, pp 43–69.
- https://www.americanlaboratory.com/913-Technical-Articles/18626-Modifications- of-DNA-in-Relation-to-Diabetes-Identification-of-Carboxymethyl-2-Deoxyadenosine-From-Glycoxidation-Reactions-Calf-Thymus-DNA-Human-Urine-and-DNA/.
- https://www.americanlaboratory.com/913-Technical-Articles/122551-Modification-of-DNA-in-Relation-to-Diabetes-Identification-of-CMdC-From-Glycoxidation-Reactions-and-Estimation-of-CMdCand-CMdA-in-Fasting-Human-Urine/.
- https://www.americanlaboratory.com/ Specialty/Clinical/914-Application-Notes/167580-Application-Note/.
- Lila, Z.A.; Thomas, Y. et al. DNA modification in diabetics and obese persons: detection of carboxymethyl-2’-deoxycytidine (CMdC) in biological sample. Proceedings of the Network of Minority Research Investigators, April 15–17, 2015, Bethesda, Md.
- Lila, Z.A.; Flowers, D. et al. Modification of DNA (dA) and RNA (A) in relation to diabetes and obesity: detection of carboxymethyl- 2’-deoxyadenosine (CMdA) and carboxymethyl-adenosine (CMAd) in diabetic and obese urine. Proceedings of the Network of Minority Research Investigators, April 14–15, 2014, Bethesda, Md.
Zeenat Ara Lila and Louis D. Whitesides are with the 1890 Research Department, South Carolina State University, 300 College St., Orangeburg, S.C. 29117, U.S.A.; tel.: 803-533-3925; fax: 803-533-3792, e-mail: [email protected]. Chukudi Weze and Yazmine Thomas are with the Department of Biological and Physical Sciences, South Carolina State University. The authors acknowledge the following: 1890 Evans-Allen Research Program, South Carolina State University; Dr. William E. Cotham, associate director, Mass Spectrometry Laboratory, University of South Carolina; Dr. Brian W. Kendall, medical director, Hospitalist Services, Regional Medical Center, Orangeburg, S.C.; Mr. Gary C. Ferguson, director, Department of Pathology and Laboratory Medicine, Regional Medical Center; Mr. Erik J. Simensen, program director, Institute of Public Health Research and Outreach, Orangeburg, S.C.; Mrs. Pamela Laursen, grants coordinator, 1890 Research; and Mrs. Shobha Choudhari, statistician, 1890 Research.