While handheld portable Raman is now well established, until recently, microRaman had yet to make the leap out of the laboratory and into the world at large. To meet that challenge, BioTools (Jupiter, Fla.) has launched two portable Raman microscopes, the Mobile μRaman and μ-BioRaman. Representing a happy convergence of current trends, the new instruments are smaller, simpler, faster and economical, allowing the same analyses to be performed in different locations with the same instrumentation.
Although movement toward a smaller, portable system often brings a loss in functionality, this new configuration expands capabilities by using shorter light paths, lower laser power and faster piezo scanning. Multiple sample holders accommodate vials and cuvettes as well as microscope slides and syringes. With the advent of surface-enhanced Raman spectroscopy (SERS) substrates (discussed below), analyses can be conducted on samples as small as a few microliters or concentrations of a few parts per million, typically in less than a minute. The result is a flexible, multipurpose system that is well suited for industry and academe as well as for pharma, forensics, food and environmental laboratories. One instrument can be shared among groups or departments, easily transitioning from the laboratory to the pilot plant, from the doctor’s office to a crime scene or out into the field.
Rapid, sensitive Raman mapping
Both Mobile μRaman and μ-BioRaman feature high NA objectives (40×, 50× or 100×) that maximize signal intensity while imaging from shallow depths of field for precise data collection, whether on the surface or within the sample. The optics are complemented by a cooled 2048 × 1 pixel back-thinned array detector to ensure a signal-to-noise ratio that produces both clean imaging and clear spectra.
The PZT stage and SameSpot optical system, standard on all BioTools portable Raman microscopes, enable Raman spectra to be collected precisely from the area being viewed. The stage provides 10-mm travel in the X, Y and Z directions with 10-nm step size, enabling accurate positioning for single spectra and rapid scanning for Raman maps.
Compact architecture and integrated optics optimize performance—a typical spectrum can be collected in less than 10 seconds. Furthermore, when combined with use of a SERS substrate, these instruments typically require only 4–8 scans to provide clear, definitive results. The short light path also lessens the requirements for laser power to the low-mW range, making them gentle on the sample.
Dealing with fluorescence
Because fluorescence is 1000 times more intense than the Raman signal, it is often a challenge to collect good Raman signatures. The BioTools microscopes minimize this problem by using a 785-nm light source, a wavelength that is just outside the visible range and is therefore less likely to excite interfering fluorescence. In the few instances in which fluorescence is a problem, it can often be quenched prior to acquiring the Raman spectra, or can be treated mathematically using a baseline correction.
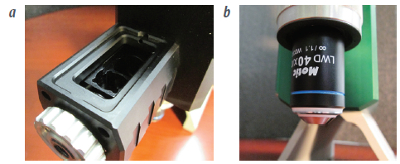 Figure 1 – a) Conventional Raman sample holder for vials, cuvettes and macro samples of solids. b) Microscopy system for imaging and slides, including SERS substrates.
No sample limits
Mobile μRaman and μ-BioRaman microscopes feature multiple sample modalities. As shown in Figure 1, they contain sample holders for cuvettes and vials (Figure 1a) as well as microscope slides and SERS substrates (Figure 1b). As a result, the instruments are able to handle everything from powders, liquids and fibers to crystals, gunshot residue and dried blood samples.
Analyzing biologics within a syringe
Biologics are typically delivered via injection or infusion and are formulated within the syringes used for delivery. They may arrive at the point-of-care premixed or as liquid over solid in multichambered syringes. The μ-BioRaman features a special syringe sample compartment enabling quality control by either the manufacturer or at the point-of-care to confirm that the biologic’s structure has been conserved between formulation, packaging and delivery. Of special interest are proteins such as monoclonal antibodies.
Because the Raman beam can be focused at varying depths, it can be focused on the inner wall of the syringe to determine the presence of an oil coating, and then refocused further into the syringe to test the biologic itself. The syringe can be moved up and down within the sample holder, so that if the biologic is delivered unmixed, Raman spectra can be collected for individual layers such as diluent, filler and actual biologic. Biologics presented in either glass or plastic syringes can be analyzed.
Getting a boost from SERS
While the portable Raman microscopes are built to gather conventional Raman spectra, new opportunities unfold when they are used with SERS substrates or capillaries. Data collection speeds up, sensitivity spikes and fluorescence disappears. As discussed in several of the applications below, the enhanced sensitivity allows for trace detection of entities such as bodily fluids and much greater discrimination and differentiation between members of similar populations, classes or species.
Conventional Raman spectra are generated by the inelastic scattering resulting from the interaction of the excitation beam and the sample.
These spectra are collected from liquids or solids typically mounted in cuvettes, vials or on microscope slides. In contrast, SERS experiments are conducted on special substrates. In microscopy, these substrates are typically gold or silver nanoparticles. When the frequency of incident photons from the laser matches the natural frequency of surface electrons in the SERS substrate, the magnitude of the electrical field surrounding the metal in the substrate increases. Since the intensity of Raman spectra is proportional to the electric field, the increased electrical field of the surface enhances the Raman signal, often by a power of 103 to 106.
Because this effect operates over very small distances, the SERS signal comes from the area of the sample immediately adjacent to the substrate and therefore represents a smaller, highly defined population of that immediate neighborhood. For example, data could come from the surface and near-surface of a single cell. In comparison, the typical Raman signal comes from a much broader area such as the whole cell or a collection of cells and is therefore characteristic of a more heterogeneous population. As a result, SERS spectra are often more discriminating.
Integrated libraries facilitate spectral interpretation
Raman can be daunting to microscopists who are unfamiliar with spectra. For contaminants and identification, mobile μRaman interfaces with KnowItAll Raman ID Expert (www.knowitall.com) from Bio-Rad (Hercules, Calif.), a database containing nearly 10,000 Raman spectra. If KnowItAll is not able to find a direct match, it analyzes the spectra for problems and then suggests ways to fix them.
For proteins, BioTools offers its own library that covers protein spectra in both solution and solid form.
Applications
Forensics analysis
While Raman has become an important part of the law enforcement arsenal for characterizing gunshot residue, inks, paints, fibers, hair, drugs, explosives, fingerprints, contaminants and other trace evidence,3 portability has special import for forensics. Being able to take a lab-quality mobile Raman microscope directly to the crime scene speeds analysis, maintains the chain of custody and increases the potential to apprehend the criminal sooner.
Figure 2a illustrates the clear differentiation of SERS spectra from various body fluids.4 Rather than hours or days, using the Mobile μ-Raman, the signatures were acquired quickly, often in less than 1 minute, with unsurpassed sensitivity.
 Figure 2 – SERS of human body fluids. a) Spectra of diluted dried human blood, semen, vaginal fluid, saliva and urine (~4 spectra, 10 sec each with ~1 mW at 785 nm). b) Converting the spectrum to a “bar code.”
Researchers at Boston University’s Department of Chemistry and the Photonics Center have developed a mathematical treatment that takes the ability to discriminate a step further (see Refs. 1–4 for specific applications). As illustrated in Figure 2b, they use the slopes in the SERS spectra to create a “bar code.” The downward slopes are shown as dark bands (with the width determined by the band of wavenumbers covered by that slope), and the upward slopes as bright bands. Applying principal component analysis (PCA) to the bar codes provides increased separation and definition of the components of the sample under investigation.
Protein analysis
Proteins have highly convoluted structures and often behave very differently as solids than they do in solution. Because conformation determines their activity, it is helpful to compare the spectra of proteins in both liquids and solids, especially during the lyophilization (freeze-drying under high vacuum) used during the formulation of many therapeutic compounds. Existing approaches include FTIR with an attenuated total reflection (ATR) objective and pelletization. However, there are problems with the ATR crystal binding to the proteins, and both ATR and pelletization require removing the sample from the vials and exposing the protein to air.
With μ-BioRaman, solids and liquids can be measured under the microscope (Figure 3), on conventional or SERS substrates, directly in the vial used for lyophilization or in a syringe. Measurements can be made either in the laboratory or near the assembly line. The microscope reveals contaminants in the protein powder and crystallization process while the Raman spectra track the protein structure.
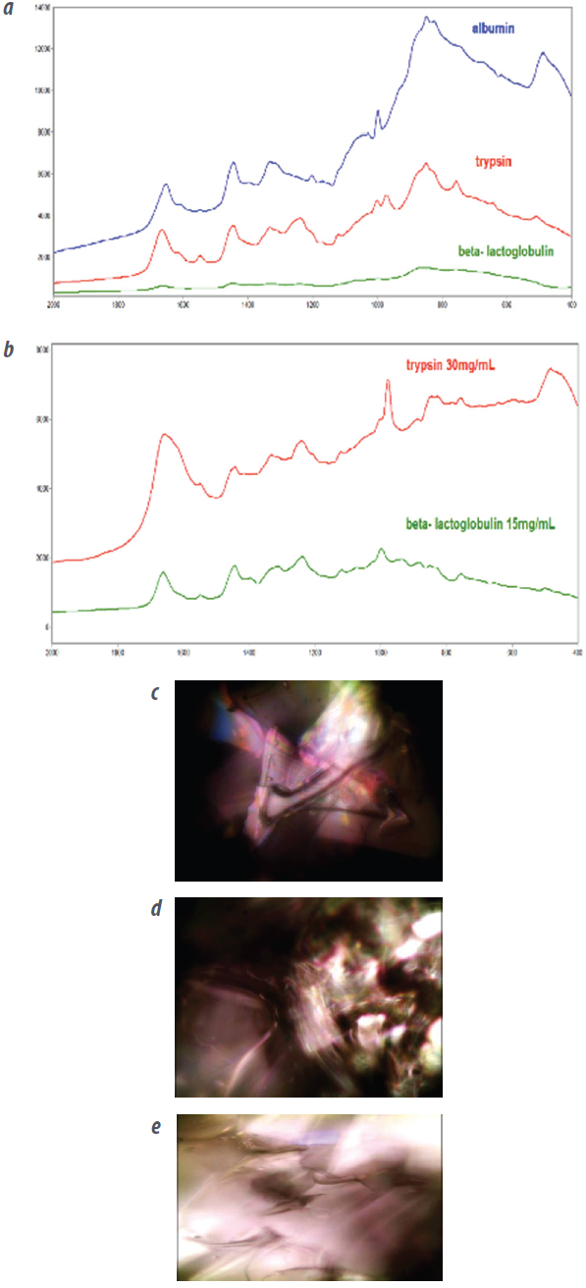 Figure 3 – Portable Raman microscope analysis of a protein. a) Spectrum of the protein as a solid. b) Spectrum of the protein in solution. (c-e) Watching the crystallization process under the microscope. All analyses were conducted on the μ-BioRaman.
Bacteria, metabolic and cancer analysis
Fighting infections is a daily challenge faced by medical staff, and with so many strains of bacteria becoming resistant to antibiotics, it is important to choose the right drug as quickly as possible. However, the current approach often delays treatment for hours, if cells can be processed for PCR, or days, if cells require culturing. SERS cuts that time to minutes,1,2 and requires 10 μL or less of fluid.
The SERS method is also more specific since these spectra correlate to readily defined genomic factors and metabolites at or near the surface of individual cells. As a result, SERS spectra can even discriminate between clinical strains of different species. The efficient optical train and easy sample handling of the portable Raman microscopes facilitate this type of analysis. New applications include the diagnosis of malaria, based on hemazoin formation, and urinary tract infections and the in vivo and in vitro detection of cancers based on anomalous cell surface features, metabolic activity or altered levels of nucleic acids, proteins, saccharides or lipids.
Particle analysis
Particle analysis is central to characterizing many structure–function relationships, which are especially important for industrial applications, geology and mining, environmental sciences and pharmaceuticals. Mobile μRaman now makes these analyses available in the pilot plant, near the production line or in the classroom. The microscope images identify context and particle morphology while the Raman component reports on chemical composition and crystalline phase. This type of analysis can be conducted on either organic or inorganic materials.
Summary
The new family of mobile microRaman microscopes offers “Raman microscopy on-the-go.” Their portable design enhances speed and sensitivity while economizing on laser power. Incorporating multiple sample modalities, they are an easy-to-use, cost-effective alternative to multiple instruments normally required for these analyses. Moving from the lab to the pilot plant, from the clinic to the classroom, or from the local lake to the crime scene, they promise to significantly expand Raman’s analytical capabilities.
References
- Premasiri, W.R.; Sauer-Budge, A.F. et al. Rapid bacterial diagnostics via surfaceenhanced Raman microscopy. Raman Tech. for Today’s Spectroscopists June 2012, 40–9.
- Premasiri, W.R.; Lemler, P. et al. SERS analysis of bacteria, human blood, and cancer cells: a metabolomic and diagnostic tool. In Frontiers of Surface Enhanced Raman Scattering: Single Nanoparticles and Single Cells, John Wiley & Sons, New York, N.Y., 2014, Chapter 12.
- Muro, C.K.; Doty, K.C. et al. Vibrational spectroscopy: recent developments to revolutionize forensic science. ACS Special Issue: Fundamental and Applied Reviews in Analytical Chemistry 2015, Nov 10, 2014, 306–27.
- Fore, J.; Premasiri, W.R. et al. Body Fluid Analysis by Surface Enhanced Raman Spectroscopy (SERS) for Forensic Applications. Presented at ICORS2014, Aug 10–15, 2014, Jena, Germany.
Barbara Foster, president of The Microscopy & Imaging Place, Inc. (McKinney, Tx.), can be reached at [email protected]. The author thanks Drs. Rina Dukor (BioTools, Jupiter, Fla.), Igor Lednev (University of Albany, Albany , N.Y. ) a n d Lawrence Ziegler (Boston University, Boston, Mass.) for their help in the preparation of this manuscript.