While the health benefits of extra virgin olive oil (EVOO) are well documented, the purity of any specific batch remains highly debatable. The great demand for EVOO, paired with the relatively high production costs, has incentivized unlawful adulteration, rendering EVOO one of the most fraudulent foods. Although EVOO is typically diluted with cheaper oils, including soybean and corn, the addition of more deleterious diluents (e.g., yellow aniline) have also been reported. Centralized regulatory agencies and analytical methods have looked for reliable protocols with which to identify and even quantify instances of economic adulteration. This has included the use of GC and/or hyphenated mass spectrometry techniques (e.g., LC-MS).
Proton nuclear magnetic resonance spectroscopy (1H NMR) offers an attractive alternative to these more cumbersome analytical methods. Benefits include facile and repeatable sample preparation, simplified data analysis and versatile multicomponent screening. 1H NMR is not limited to a specific temperature, solvent or flow protocol. Instead, each spectrum contains resonances of every hydrogen-containing component within a sample, and every component has an equal response factor. This means that the relative concentration of each component can be assessed directly without the need for elaborate calibration methods.
Despite the potential benefits of introducing 1H NMR into a regulatory environment, the large physical size of traditional NMR spectrometers paired with the capital required to purchase and maintain these instruments has made incorporation of this technique into food science largely unrealistic. Recent advances in permanent rare earth magnet technology and the development of a new class of benchtop NMR spectrometers have begun to alleviate these barriers. Benchtop NMR spectrometers are typically easier to use and more affordable than their high-field counterparts. They are compact enough to be introduced into any standard laboratory environment. Although the resolution they offer is lower, benchtop spectrometers have sufficiently homogeneous magnetic fields to accurately speciate and quantitate. This paper highlights the efficacy of benchtop NMR technology for the quantification of soybean oil content in EVOO.
Edible oils are triglycerides of saturated (e.g., palmitic and stearic) and unsaturated (e.g., oleic, linoleic and α-linolenic acid) fatty acids. Due to their composite nature, interpreting 1H NMR spectra of oils first requires an understanding of discrete free fatty acid. Free fatty acids can have up to six chemical signatures1: carboxylic acids, olefins, bis-allylics, allylic/α-CH2’s and alkyls, as shown in Figure 1. The allylic/α-CH2’s are defined as the methylene moieties adjacent to either a carbonyl or a vinyl, while bis-allylic resonances are the methylene linkages connecting two vinyl groups. Although the individual components of these fatty acids are not fully resolved at 60 MHz, integrals taken of the defined regions can accurately distinguish the various fatty acid forms. Alkyl and α-carbon components are observed in spectra of saturated fatty acids (Figure 1a), whereas the unsaturated fatty acids (Figure 1b) give more complex and informative spectra that integrate according to the degree of saturation and the number of protons for each functional group.
 Figure 1 – Stacked 60-MHz 1H NMR spectra for: a) saturated and b) unsaturated fatty acids. The corresponding functional groups are labeled above the appropriate resonance. The peak integral regions are defined as: carboxylic acid (COOH) (δ 10.50–12.00), olefin (CH=CH) (δ 4.92–5.67), bis-allylic (=CH-CH2 -CH=) (δ 2.50–3.05), allylic/alpha-C (=CH-CH2-alkyl or O=C-CH2 ) (δ 1.75–2.50) and alkyl (-CH2 /-CH3) (δ 0.46–1.75 ppm). (Reproduced with permission from Chemical & Engineering News; http://www.heterobetainas.uah.es/intranet/REVISTA%20CHEM&ENG%20NEWS/cen20140602- EUR-dl.pdf)
Edible oils will have similar 1H NMR spectra, save that: 1) the carboxylic acid moiety is replaced by glyceride linkages (–CH2-/-CH-δ 3.82–4.5 ppm) (Figure 2) and 2) the integrations of the chemically distinct spectral resonance ranges reflect the percent composition of fatty acids for a specific edible oil (Table 1). Consequently, 1H NMR spectroscopy can be used directly to differentiate edible oils with different characteristic fatty acid profiles.
Table 1 – Percent composition of extra virgin olive oil and soybean oil
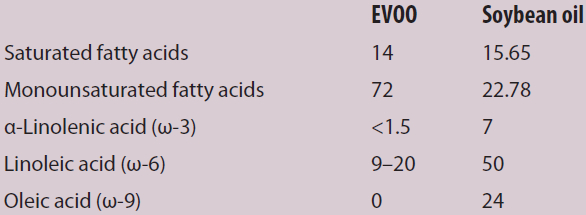
The most expedient way to distinguish EVOO and soybean oil is the bis-allylic region. EVOO is composed primarily of monounsaturated fatty acids and the polyunsaturated, bis-allylic-containing fatty acids represent only a small component of EVOO. In contrast, soybean oil comprises 50–60% polyunsaturated fatty acids, with linoleic acid (ω-6) representing the major component. As a result, the bis-allylic region in pure soybean oil, or soybean-adulterated EVOO, is much more intense than genuinely pure EVOO samples. Determining the absolute integration of all components relative to the amount of bis-allylic protons provides a direct indication of adulteration; larger-than-expected composition signifies the presence of polyunsaturated fatty acids.
Alternatively, we can observe and quantify the amount of adulteration. Stock solutions of EVOO and soybean oil were prepared (~0.5 M in CDCl3) and used to make EVOO samples doped at 5, 10, 20, 25, 30, 35, 40, 45, 50 and 60 (vol/vol)% soybean oil. Three sets of stock solutions were prepared for analysis (these will be referred to as ”trials” throughout the text). An NMReady benchtop spectrometer (Nanalysis Corp., Calgary, Alb.) was used to acquire 60-MHz 1H NMR spectra in triplicate for all samples to ensure measurement repeatability. Spectra were measured with eight scans at a 12-ppm spectral window, 2k points, 0.1-Hz apodization and 5-second relaxation delay.
Using the MNova spectral processing program (Mestrelab Research, Escondido, Calif.), the same phase and baseline corrections were applied to each spectrum. The spectra were then δ-referenced to residual CHCl3 (δ = 7.24 ppm). A stacked plot example is shown in Figure 3a. Once referenced, the spectra were integrated with the predefined regions.
 Figure 3 – a) Stacked 60-MHz 1H NMR spectra of olive oil samples manually adulterated with soybean oil. b) Amount of soybean oil adulteration as determined by the percentage of
 bis
-allylic protons in each EVOO sample.The percentage of bis-allylic protons was calculated for each spectrum using the absolute integration of the bis-allylic region relative to the total sample absolute integration. For each trial, the values measured in triplicate were averaged. These three averages, along with the overall average of all data obtained, were plotted versus the known amount of soybean oil adulteration to establish accuracy and linearity of the method (Figure 3b).
The repeatability of the measurement is depicted in Figure 4a by overlaying the acquired spectra. The zoom on the bis-allylic region shows good agreement between the three trials. The bis-allylic absolute integration mean and median are reported along with standard deviation for the three trials (Figure 4b). Once prepared, this linear calibration curve can be used within unknown samples of EVOO to determine how much, if any, soybean oil was added to the sample within a few percent.
 Figure 4 – a) Overlaid 1H NMR spectra of three trials of EVOO doped at 35% soybean oil. b) Mean, median and standard deviation (STD) for the average for the trial samples.
Summary
Benchtop NMR spectroscopy has been demonstrated to be an effective tool for identifying and quantifying soybean adulteration in EVOO samples. Although benchtop NMR affords less resolution than traditional NMR spectrometers, there is still sufficient resolution to accurately and repeatedly identify differences in fatty acid composition. Additionally, these spectra can be used to easily assess the presence of other contaminants. For example, the aromatic peaks of yellow aniline would be very apparent in the range of 6.0–8.0 ppm. We are now looking to: 1) expand this method to other EVOO adulterants, 2) examine a wider range of EVOO samples, 3) better understand the accuracy and utility of NMR for comprehending the origin and purity of samples and 4) expand benchtop NMR techniques to support quality assurance in other areas of food science.
Reference
- Knothe, G. and Kenar, J.A. Determination of fatty acid profile by 1H NMR spectroscopy. Eur. J. Lip. Sci. and Tech. 2004, 106(2), 88–96.
Susanne D. Riegel is manager of application chemistry, Nanalysis Corp., Bay 4 4500 5 St. NE, Calgary, Alb., Canada, T2E 7C3; tel.: 1.855.667.3239; e-mail: [email protected]; www.nanalysis.com