Various species of methacrylates are widely used in dentistry as filling materials. These consist mainly of an organic matrix, based on a monomer system of methacrylates and inorganic additives. The mechanical properties and biological features of such composite resins are highly influenced by their monomer–polymer conversion. A low degree of polymerization may impair the local biocompatibility and result in irritation, inflammation, and necrosis caused by leachable residual monomers. The subject of this study was the qualitative and quantitative analysis of residual monomers by HPLC-MS and GC-MS. The methods presented enable a sensitive determination of base monomers and co-monomers in dental materials.
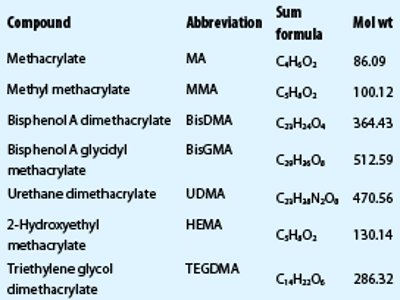
Table 1 – Basic compounds of dental composite materials
Introduction
The desire for natural tooth restoration led to the development of a multitude of synthetic resins in modern chemistry. Methacrylate-based resins were introduced in dentistry as early as 1937, but they did not demonstrate optimal properties.1 In the period following that, new techniques,2 polymer materials,3 and composite resins4–6 were developed. Today, composite tooth restoration materials are widely used in general dental practice and are often favored by patients.7
Differences in the physical properties and lifetimes of classic and modern restoration materials have been reported.8–10 Composite fillings may wear and age in the oral environment, assisted by leaching out due to the acidic components of the saliva, acidic diet, heating by hot foods or hot beverages, and alcoholic beverages. This results in detachment of residual monomers11–14 and inorganic additives,15 which may lead to adverse effects on human health.16
Methacrylate-based dental composite materials
Commercial dental composite materials consist of an organic matrix and embedded inorganic filling materials.4 In general, the organic matrix contains a di- or tri-ester of methacrylic acid such as methyl acrylate (MA) or methyl methacrylate (MMA), and can be classified into two basic components: base monomers and co-monomers with a lower molecular weight.4,6Table 1 gives an overview of compounds of dental composite materials.
BisGMA is one of the most popular base monomers and is found in the majority of composite materials. TEGDMA is typically used as a co-monomer.4,6 In general, dental composite materials are generated by photopolymerization using ultraviolet (UV) light in a three-step process.17 Further components of dental composites are inhibitors of photopolymerization, UV stabilizers, dyes, and pigments, as well as inorganic filling materials such as glass, glass ceramic, silicates, and silicon dioxide.4,13,18 Figure 1 shows the chemical structures of the compounds analyzed in the present study.
Biological compatibility
In addition to the advantages of composite materials—i.e., good mechanical strength, wide variety of colors, and excellent workability—the biological compatibility of the components and their effects on human health are often an issue. Some ingredients may cause chronic pulpitis,19 irritate oral tissues, show bacterial growth inhibitory effects, or lead to allergic reactions.18 Furthermore, cytotoxic, genotoxic, mutagenic, or estrogenic effects may be caused by monomers or filling materials released from the composite materials.11,16,20–24 Elution from the resin materials is related to the conversion of the monomers during polymerization (usually only 35–77%25), chemical properties, and molecule size.11
 Figure 1 – Chemical structures of the basic substances of dental composite materials.
Analysis methods for determination of monomers
Many analysis methods have been developed for the identification and quantification of leachable residual components of dental composite materials after polymerization. Spahl et al. presented methods using gas chromatography coupled to mass spectrometry (GC-MS) or high-performance liquid chromatography-particle beam-mass spectrometry (LC-PB-MS) for the determination of water and methanol extracts.25 Rogalewicz et al. described an HPLC-MS method to determine organic leachable compounds from commercial resin-modified glass ionomers.26 Average measurement errors of 16% (GC-MS) and 24% (LC-PB-MS) were reported for the whole method, including the extraction procedure of leachable compounds,25 but no information was provided on the precision of the instrument analysis method.25,26
In the study presented here, two methods were developed and validated for the determination of base and co-monomers of dental composite materials before polymerization by GC-MS and HPLC-MS.
Experimental
Chemicals and reagents
The calibration standards—HEMA (≥99%), BisDMA (>98%), BisGMA (89.9–99.9%), UDMA (≥97%), TEGDMA (≥95.0%), MA (99%), and MMA (99%)—were purchased from Sigma Aldrich (Steinheim, Germany). All solvents used were of HPLC gradient grade. Acetonitrile ROTISOLV®, dichloromethane ROTISOLV, and methanol ROTISOLV were purchased from Roth (Karlsruhe, Germany); formic acid (98–100%, for analysis) was from AppliChem (Darmstadt, Germany); and the resin samples Arabesk Flow and Arabesk Top were from Voco (Cuxhaven, Germany).
Standard and sample preparation
Sample preparation in HPLC-MS analysis included the preparation of stock solutions of TEGDMA, BisDMA, BisGMA, and UDMA in a concentration of 2000 mg/L in acetonitrile. From these stock solutions, four calibration standards were prepared in a concentration range of 5–100 μg/L for TEGDMA and UDMA, 10–500 μg/L for BisGMA, and 10–250 μg/L for BisDMA. The real resin samples were dissolved in acetonitrile for subsequent analysis: Arabesk Top in a concentration of 150 μg/L and Arabesk Flow in a concentration of 200 μg/L.
For GC-MS analysis, stock solutions of TEGDMA, HEMA, MMA, and MA were prepared in a concentration of 10,000 mg/L in dichloromethane. From these stock solutions, four calibration standards were prepared in a concentration range of 5–50 mg/L for TEGDMA and HEMA, 5–100 mg/L for MMA, and 1–100 mg/L for MA. The real resin samples were prepared in dichloromethane with concentrations of 500 mg/L for Arabesk Top and 300 mg/L for Arabesk Flow.
Instrumentation and parameters
For HPLC-MS analysis, an Agilent LC-MS system comprised of the G1312B binary pump, G1367C high-performance autosampler, G1316B temperature-controlled column compartment, and G1969A time-of-flight mass spectrometer (TOF-MS) was used (Agilent Technologies, Waldbronn, Germany). The HPLC separation column was a Zorbax Eclipse XDB-C18 (Agilent Technologies) with a length of 150 mm, inner diameter of 4.6 mm, and particle size of 5 μm.
HPLC separation was performed using the following parameters: 10 μL injection volume, 1 mL/min flow rate, acetonitrile and water with 0.1% formic acid (65:35, v/v) as mobile phase, isocratic elution, and 45 °C (113 °F) column temperature. Mass spectrometric analysis was performed using electrospray ionization (ESI) with positive ion polarity. Nitrogen was used as the drying gas with a flow of 10 L/min and a temperature of 300 °C (572 °F). The nebulizer pressure was set to 35 psig, capillary voltage to 4000 V, fragmentor voltage to 250 V, and skimmer voltage to 60 V. Data acquisition was performed in a mass range from 50 to 1000 m/z.
The GC-MS analysis system consisted of a 7693A automated liquid sampler, G4513A injector, and 7890A gas chromatograph coupled to a 5975C mass selective detector (MSD) with electron impact ionization (EI) (all from Agilent Technologies). GC separation was performed with helium as the mobile phase and two HP-5MS columns (Agilent Technologies) with a length of 30 m (column 1) and 3.5 m (column 2), inner diameter of 0.25 mm, and film thickness of 0.25 μm.
Sample injection was carried out with a volume of 1 μL, split ratio of 10:1, and inlet heater temperature of 250 °C (482 °F). The flow rates were set to 1 mL/min for column 1 and 1.2 mL/min for column 2. The oven program started with a temperature of 35 °C (95 °F) for 2 min, followed by a ramp of 8 °C/min (46.4 °F/min) to a final temperature of 300 °C (572 °F), which was held for 5 min. The mass spectrometer parameters were set to 300 °C (572 °F) for the transfer line, 230 °C (446 °F) for the MS source, and 150 °C (302 °F) for the quadrupole. Data acquisition was performed in SCAN mode with a mass range of 50–1000 m/z and solvent delay of 3.5 min.
Results and discussion
The HPLC-MS method enables the determination of quantities of TEGDMA, BisDMA, BisGMA, and UDMA. Using the GC-MS method, TEGDMA, HEMA, MMA, and MA were analyzed. Figure 2 shows chromatograms with all compounds recorded by HPLC-MS and GC-MS. For method validation, several experiments were performed, and these are presented in the following sections.
 Figure 2 – Chromatograms (total ion current). Top: HPLC-MS with 5-ppm signals of TEGDMA, UDMA, BisGMA, BisDMA, and internal standard caffeine. Bottom: GC-MS with 50-ppm signals of MA, MMA, HEMA, TEGDMA, and internal standard caffeine.
Repeat accuracy and within-laboratory precision
The repeat accuracy was determined with measurements of 25 independent samples prepared on the same day. The results show coefficients of variation (CV) of 3.3–4.4% (HPLC-MS) and 3.6–4.9% (GC-MS). Furthermore, the within-laboratory precision was performed by two operators using measurements of three samples on five consecutive days. The results in both methods show good correlation between the two operators, and CV values of 3.2–7.5%; only UDMA showed a slightly higher CV.
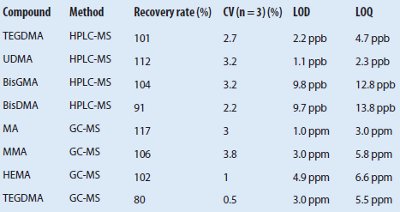
Table 2 – Recovery rates, LOD, and LOQ determined by HPLC-MS and GC-MS
Recovery rates
Determination of recovery rates was performed with three replicate measurements of standard solutions and spiked natural samples. Recovery rates were 91–112% (HPLC-MS) and 80–117% (GC-MS). TEGDMA determined by GC-MS shows a significantly lower value than HPLC-MS (see Table 2). To confirm these results, a sample of Arabesk Top was spiked with TEGDMA, UDMA, BisGMA, and HEMA. The recovery rates were determined to be 97%–102% (HPLC-MS) and 76% (HEMA) and 104% (TEGDMA) using GC-MS.
Limit of detection (LOD) and limit of quantitation (LOQ)
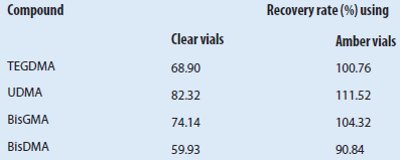
Table 3 – Comparison of recovery rates determined using clear and amber vials
Determination and calculation of the LOD and LOQ were performed with measurements of 10 independent blank samples according to Refs. 27 and 28. In the HPLC-MS method, the LOD was 1.1–9.8 ppb and the LOQ was 2.3–13.8 ppb. In the GC-MS method, the LOD was 1.0–4.9 ppm and the LOQ was 3.0–6.6 ppm. Table 2 shows the results for each compound.
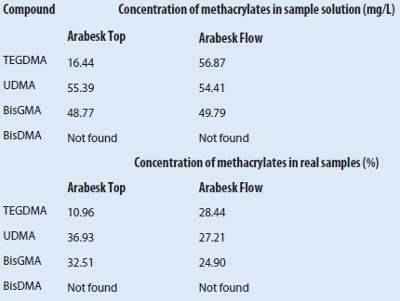
Table 4 – Measurement results: Composition of real resin samples by HPLC-MS
Robustness and measurement precision
Robustness was tested with two analytical systems and modified environmental parameters. The results acquired with two independent but identically configured LC-MS systems demonstrated very good correlation, as confirmed by comparison of the calibration equations. Furthermore, the photosensitivity of the methacrylates described by Rogalewicz et al.26 was confirmed. The recovery rates using clear vials were significantly lower than when amber vials were used (see Table 3). The measurement precision was determined with 10 measurements of the same sample. The results showed CV values of 2.2%–2.8% (HPLC-MS) and 1.1%–1.4% (GC-MS).
Real resin samples
Finally, the compositions of two commercial dental filling materials, Arabesk Top and Arabesk Flow, were determined. The values were in accordance with the data sheet from the manufacturer. TEGDMA, UDMA, and BisGMA were detected in the expected concentrations (see Table 4).
Conclusion
Two methods for the determination of methacrylate-based dental materials were developed and validated. The working area in the HPLC-MS method for the determination of TEGDMA, BisDMA, BisGMA, and UDMA is 5–500 ppb. In the GC-MS method for the determination of MA, MMA, and TEGDMA, the working area is 1–100 ppm. The measurement errors of the analytical methods were lower than the method errors reported in previous studies.25,26
The next step is to determine the resulting errors of the extraction method of leachable compounds. In the present study, the HPLC-MS method was fully automated at all stages to increase sample throughput. Work is currently being done to optimize an automated system that had been developed in earlier studies.29–33 Further investigations include 1) optimization of the GC-MS method and its integration into an automated system, and 2) development of an automated data processing system for both methods in accordance with Ref. 32. This effort will allow investigation of the effects of residual monomers on human health, and construction of suitable and robust dental materials.
References
- Bowen, R.L. J. Dent. Res. 1956, 35(3), 361–9.
- Buonocore, M.G. J. Dent. Res. 1955, 34(6), 849–53.
- Bowen, R.L. JADA 1963, 66(1), 57–64.
- Bowen, R.L. J. Dent. Res. 1979, 58(5), 1493–503.
- Tyas, M.J; Burrow, M.F. Aust. Dent. J. 2004, 49(3), 112–21.
- Buruiana, T; Melinte, V. et al. J. Polym. Sci. Pol. Chem. 2011, 49(12), 2615–26.
- Mjör, I.A.; Moorhead, J.E. et al. Acta Odontol. Scand. 1999, 57(5), 257–62.
- Pallesen, U; van Dijken, J.W. et al. J. Dent. 2013, 41(4), 297–306.
- Opdam, N.; Bronkhorst, E. et al. J. Dent. Res. 2010, 89(10), 1063–7.
- Mjör, I.A.; Jokstad, A. J. Dent. 1993, 21(6), 338–43.
- Polydorou, O.; Huberty, C. et al. J. Biomed. Mater. Res. B 2012, 100B(1), 68–74.
- Finer, Y.; Santerre, J.P. J. Biomed. Mater. Res. A 2004, 69A(2), 233–46.
- Geurtsen, W.; Spahl, V. et al. J. Biomed. Mater. Res. 1999, 48(6), 772–7.
- Geurtsen, W. Eur. J. Oral. Sci. 1998, 106(2), 687–95.
- Söderholm, K.J.; Zigan, M. et al. J. Dent. Res. 1984, 63(10), 1248–54.
- Geurtsen, W. Crit. Rev. Oral Biol. M. 2000, 11(3), 333–55.
- Song, J.; van Velde, J.W. et al. Macromolecules 2011, 44(6), 1319–26.
- Polydorou, O.; Koenig, A. et al. Eur. J. Oral Sci. 2009, 117(1), 68–75.
- Stanley, H.R.; Bowen, R.L. et al. J. Dent. Res. 1979, 58(5), 1507–17.
- Geurtsen, W.; Spahl, W. et al. J. Dent. Res. 1998, 77(12), 2012–19.
- Geurtsen, W.; Lehmann, F. et al. J. Biomed. Mater. Res. 1998, 41(3), 474–80.
- Andrews, L.S.; Clary, J.J. J. Toxicol. Env. Health 1986, 19(2), 149–64.
- Wataha, J.C.; Hanks, C.T. et al. J. Oral Rehabil. 1994, 21(4), 453–62.
- Hanks, C.T.; Craig, R.G. et al. J. Oral Pathol. Med. 1988, 17(8), 396–403.
- Spahl, W.; Budzikiewicz, H. et al. J. Dent. 1998, 26(2), 137–45.
- Rogalewicz, R.; Batko, K. et al. J. Environ. Monit. 2006, 8(7), 750–8.
- Fleischer, H.; Thurow, K. Am. Lab. 2013, 45(7), 6–9.
- Fleischer, H.; Thurow, K. Am. Lab. 2013, 45(8), 6–11.
- Fleischer, H.; Gördes, D. et al. Am. Lab. 2009, 41(7), 21–4.
- Thurow, K; Gördes, D. JALA 2006, 11(3), 128–33.
- Fleischer, H.; Thurow, K. Am. Lab. 2011, 43(9), 32–6.
- Fleischer, H.; Thurow, K. IEEE I²MTC 2013, 1624–9.
- Fleischer, H.; Thurow, K. Amino Acids 2013, 44(3), 1039–51.
Heidi Fleischer, Ph.D., is Senior Scientist, University of Rostock, Institute of Automation, Richard-Wagner-Strasse 31, 18119 Rostock, Germany; tel.: +49 (0) 381 498 7803; fax: +49 (0) 381 498 7702; e-mail: [email protected] . Ellen Vorberg is a Ph.D. student, and Kerstin Thurow, Ph.D., is CEO, Center for Life Science Automation—Celisca, Rostock, Germany. Mareike Warkentin, Ph.D., is Senior Scientist, University of Rostock, Faculty of Mechanical Engineering and Marine Technology, Rostock, Germany.