During the past few decades, a variety of theories concerning the hazards and benefits of dietary fats have been postulated, some of which seem to be contradictory. At the present time, most authorities would agree that saturated fatty acids are undesirable, that hydrogenated fats can be dangerous, that unsaturated fatty acids and particularly polyunsaturated fatty acids fall into the “good” category, that trans isomers and saturated acids contribute to cardiovascular disease, and that certain unsaturated fatty acids, notably the omega-3 and omega-6 fatty acids, have beneficial effects. It has become increasingly important to develop analytical procedures that can unambiguously differentiate the various geometric and positional forms of dietary fatty acids.
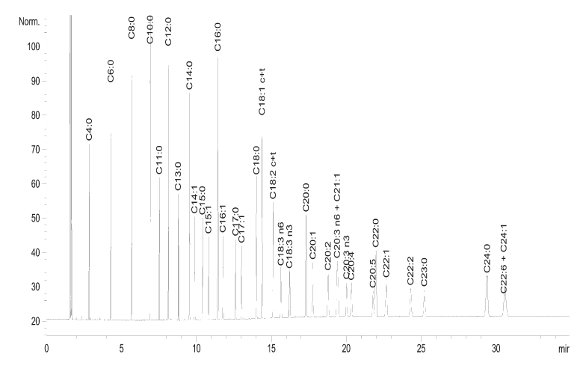
Figure 1 - The 37-component FAME standard analyzed using a capillary PEG (DB-WAX, Agilent Technologies, Folsom, CA) stationary phase column (see Table 1 for conditions).
Table 1 - Analysis conditions for Figure 1
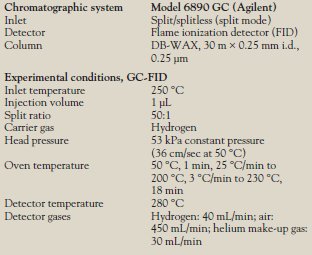
Polyethylene glycol (PEG) phases have long been employed for the separation of fatty acid methyl esters (FAMEs), and in many cases these attain good separations, particularly of the shorter-chain, lower-molecular-weight FAMEs (Figure 1). Coelutions do occur; in this example, C20:3 n6 and C21:1 fail to separate, and C22:6 and C24:1 also coelute. One of the more serious limitations of PEG is the lack of cis/trans differentiation: All cis/trans isomers coelute. Figure 2 illustrates why a stationary phase with a strong potential for dipole–dipole interactions should give improved cis/trans separations of FAMEs. If the R1 group contains the methyl ester linkage, any additional double bonds would be in either R1 or R2 or both. Ergo, the trans form offers a more balanced distribution of the molecular polarity than does the cis form, where the polarity is more heavily skewed. For cis/trans separations, a stationary phase with the potential for strong dipole interactions would be expected to preferentially retard the more polar cis isomers, while allowing the less polar trans isomers to move ahead. An early approach to exploiting this concept was the substitution of phenyl and cyanopropyl groups for some of the methyl groups on the polydimethylsiloxane (PDMS) chain. But as discussed below, highly polar columns usually necessitate some analytical compromises.
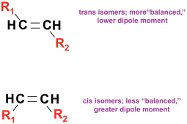
Figure 2 - Schematic of trans and cis configurations, demonstrating the “balanced polarity” of the former versus the stronger dipole of the latter.
For high column efficiency, PDMS is the “prime phase,” often capable of attaining the maximum theoretical efficiency of the analytical system. One of the reasons for this is that PDMS possesses the highest diffusion constant of stationary phases in popular use. This maximizes the efficiency of the interphase mass transport step, from stationary phase to mobile phase, in which solutes are differentiated on the basis of their net vapor pressures (i.e., their vapor pressures under a particular set of operational conditions). The net vapor pressure of a solute can be envisioned as its intrinsic vapor pressure, increased by the temperature at that point in the GC oven program, decreased by the pressure at that point in the column, and further decreased by the sum of all solute stationary phase interactions (e.g., dispersion, proton sharing, and dipole interactions) between that solute and that stationary phase under this particular set of conditions. The strengths of these interactions vary inversely with temperature. The van Deemter equation, as modified by Giddings, Golay, and Hawkes, can be expressed as:
H = 2DM/u + qu([2k/3{k+1}2][df 2/DS] + [1+6k+11k2]/[96{k+1}2] [dc2/DM])
where H is the height equivalent to a theoretical plate, i.e., N/Lmm; DM and DS are the diffusivity constants in the mobile and stationary phases, respectively; u is the average linear carrier gas velocity in cm/sec; q is a configuration factor; k is the retention factor of the test solute; df is the thickness of the stationary phase film in microns, and dc is the inner diameter of the column in millimeters.
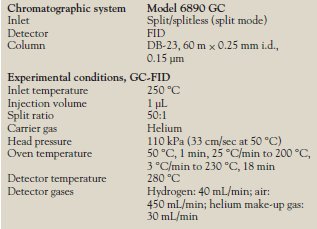
Figure 3 - Chromatogram of the 37-component FAME standard on a 60 m × 0.25 mm i.d. × 0.15 μm DB-23 column. Conditions same as in Figure 1 except: carrier gas, helium; velocity, 33 cm/sec at 50 °C. Oven: 50 °C (1 min), 25°/min to 175 °C, 4°/min to 230 °C, 5 min. Chromatogram courtesy of Pat Sandra and Frank David, Research Institute for Chromatography (RIC), Kortjik, Belgium. See Table 2 for analysis conditions and compound identification.
Table 2 - Analysis conditions for Figure 3
The [df2/DS] term is of particular importance to our discussion here.
PDMS possesses the highest diffusion constant (ca. 10–6 to 10–7 cm2 sec–1) of all stationary phases in current use.* Because of this high diffusivity, the thickness of the stationary phase film in a PDMS column can be increased from 0.1 to 0.4 μm without affecting column efficiency. As the substituent methyls are replaced with more polar groups—phenyl, trifluoropropyl, cyanopropyl—the diffusion constant drops, and column efficiencies decline in proportion to the amount of added polarity. At the higher levels of polarity, the column efficiency decreases ca. 25% as the film thickness of the column is changed from 0.15 to 0.25 μm, and declines more precipitously beyond this point. Stationary phases containing larger percentages of cyanopropyl or cyanophenyl usually produce columns of significantly lower efficiency, and longer columns may be needed to generate a sufficient number of theoretical plates. They do give good cis/trans differentiation, and, as illustrated by Figure 3, the 37-component FAME standard (Supelco, Inc., College Park, PA) is well resolved on the 60-m DB-23 (Agilent Technologies), a 50% cyanopropyl methylpolysiloxane column, including the all-cis C22:5 (eicosapentaenoic acid [EPA]) and C22:6 (dococahexaenoic acid [DHA]) omega-3s. However, there is room for improvement in these separations, and these longer columns necessitate longer analysis times.
For several years, column manufacturers have been using aryl substitutions to make stationary phases capable of tolerating higher temperatures while producing lower levels of column bleed. There are two reasons for these lower-bleed improvements: Aryl inclusions decrease the incidence of the back-biting reaction2 by stiffening the polymer chain, and they also increase the bulk of the polymer, i.e., lower its density. The column phase ratio is a function of the volume of stationary phase, and now the same volume of phase possesses a lower mass. Bleed, which is a function of the mass of stationary phase that lies in the flow path, is now decreased. This lower-density phase can also exhibit a more “open structure,” leading to columns of higher diffusivity, hence higher efficiency, i.e., more plates per meter of column length.
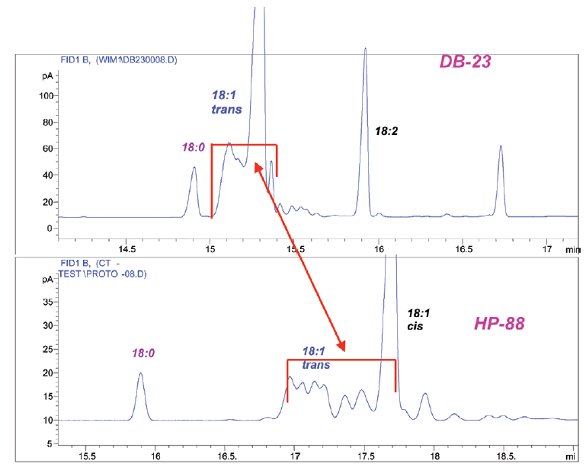
Figure 4 - Comparison of the separations of C18:1 isomers from a hydrogenated oil achieved on (top) DB-23 (same column as Figure 3) and (bottom) 100 m × 0.25 mm × 0.2 μm HP-88 column. Both analyses were isothermal at 180 °C. Chromatogram courtesy of Pat Sandra and Frank David.
These improvements were incorporated into the HP-88 column (Agilent Technologies), which has the highest level of cyanopropyl that can be inserted into this aryl-substituted chain. The aryl inclusions not only lower column bleed, but also increase high-temperature performance. In addition, they increase its diffusivity, so that efficiency is much greater than would be predicted for a column of such high polarity. It was designed with the express purpose of improving separations of cis/trans FAMEs.
Figure 4 compares the separation of an extensively hydrogenated oil sample (rich in trans fatty acids) on DB-23, 50% cyanopropyl polysiloxane, and HP-88. Both chromatograms were run at the optimum linear gas velocity at 180 °C. It is interesting to note that determinations of the trans-FAMEs content of oils by Fourier transform infrared (FTIR) spectroscopy often disagree with determinations made by GC, which are generally much lower. It has been suggested that the discrepancies between the two methods arise because GC fails to adequately separate the trans acids. In this example, a number of trans acids that become apparent in the HP-88 chromatogram are not disclosed by the DB-23 chromatogram, where they remain hidden behind the main 18:1 cis peak. This figure not only lends credibility to the FTIR versus GC argument, but also illustrates the efficacy of HP-88 for trans fatty acid determinations, suggesting that HP-88 would be a much wiser choice for the isolation and measurement of trans FAMEs.
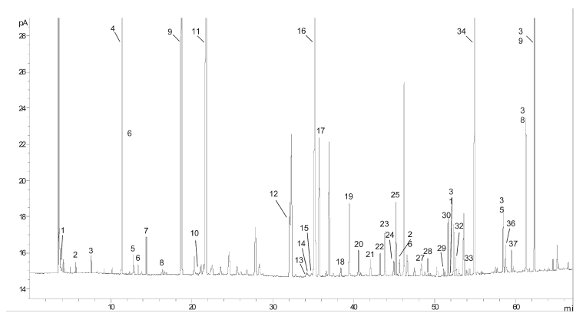
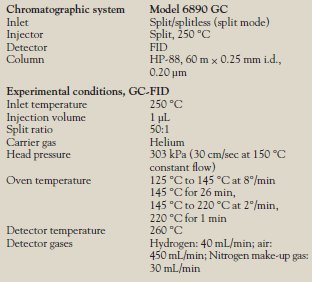
Figure 5 - GC analysis of a fish oil/omega-3 and omega-6 dietary supplement with a 60 m × 0.25 mm i.d. × 0.20 µm film, HP-88. See Table 3 for analysis conditions and compound identification immediately below.
| 1. nC6:0 | 21. C18:3 gamma (6c,9c,12c) |
| 2. nC10:0 | 22. nC20:0 |
| 3. nC12:0 | 23. C20:1 (8c) |
| 4. nC14:0 | 24. C18:2 conj. |
| 5. C14:1 (9t) | 25. C20:1 (8c) |
| 6. C14.:1 (9c) | 26. C20:1 (11c) |
| 7. nC15:0 | 27. C20:2 (11c,14c) |
| 8. C15:1 (10t) | 28. C20:3 (8c,11c,14c) |
| 9. nC16:0 | 29. nC22:0 |
| 10. C16:1 (9t) | 30. C22:1 (13t) |
| 11. C16:1 (9c) | 31. C20:3 (11c,14c,17c) |
| 12. nC18:0 | 32. C21:2 (12c,15c) |
| 13. C18:1 (6t) | 33. C22:1 (13c) |
| 14. C18:1 (9t) | 34. C20:5 (EPA) |
| 15. C18:1 (6c) | 35. C22:3 (13c,16c,19c |
| 16. C18:1 (9c) | 36. C22:4 (7c,10c,13c,16c) |
| 17. C18:1 (11c) | 37. C24:1 (15c) |
| 18. C19:1 (10t) | 38. C22:5 (DPA) |
| 19. nC19:0 | 39. C22:6 (DHA) |
| 20. C19:1 (10c) | |
Table 3 - Analysis conditions for Figure 5
HP-88 was originally produced as a 100-m column, but several advanced users soon recognized its very high efficiency and began using columns of shorter length. Shorter columns have lower pressure drops, and their van Deemter curves are flatter and exhibit higher optimum velocities. Van Deemter curves are k-specific, and flatter curves mean that solutes exhibiting a wider range of retention factors (k) can be accommodated at some one velocity with greater overall efficiency. Solutes now traverse a shorter route at a higher velocity, a win-win situation.
Figure 5 demonstrates a 60-m HP-88 column used for the identification of fatty acids in a commercially available fish oil/omega-3 and omega-6 dietary supplement. Good resolution is obtained for the essential fatty acids of interest, but also noted is the presence of several trans isomers, indicating that the source of the oils is perhaps adulterated or otherwise not “virgin” quality.
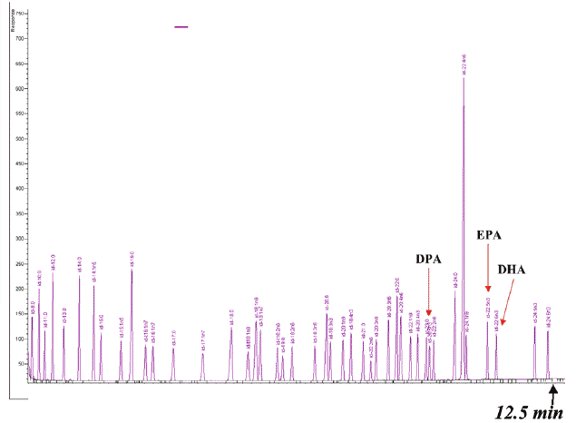
Figure 6 - FAME chromatogram on a 30 m × 0.25 mm i.d. × 0.2 μm HP-88 column. Contributed by Ryan Davis, Lipomics Technologies.
One of the first industrial scientists to utilize shorter versions of the HP-88 column was Ryan Davis of Lipomics Technologies (West Sacramento, CA). Figure 6 shows one of his routine analyses, which in 12.5 min demonstrated full resolution of a FAME mixture, including the omega-3 and omega-6 FAMEs. In the interest of decreasing analysis times while preserving resolution, 60- and 30-m versions of the original HP-88 column are also available.
*In the earlier days of packed columns, silicone fluids (SF-96 [General Electric, Schenectady, NY], OV-101 [Ohio Valley Specialty, Marietta, OH]) were favored over the cross-linked silicone gums (OV-1 [Ohio Valley Specialty], SE-30 [General Electric]) in the belief that diffusion would be higher in the nonviscous liquids than in the high-viscosity gums. When it was discovered that open tubular columns were much more stable if coated with more viscous phases, there was a shift to PDMS gums. Shortly after this, Stephen Hawkes (Dept. of Chemistry, Oregon State University, Corvallis, OR) established that diffusion constants in the PDMS gums were actually higher than those in the less viscous fluids.1
References
- Millen, W.; Hawkes, S. J.Chromatogr. Sci. 1997, 15, 148–50.
- Markides, K.; Blomberg, L.; Hoffman, S.; Buijten, J.; Wännman, T. J.Chromatogr.1984, 302, 319.
- Schmidt, S.; Hoffmann, S.; Blomberg, L. J. High Res. Chromatogr. 1985, 8, 734–40.
Mr. Vickers is GC Applications Chemist, Agilent Technologies, 91 Blue Ravine Rd., Folsom, CA 95630, U.S.A.; tel.: 916-788-6402; e-mail: [email protected].