Hydraulic fracturing (energy extraction) was invented by Floyd Farris and Joseph Clark (Stanolind Oil and Gas Corporation) in 1947 for the mining industry, but the modern horizontal fracking technique, which made the extraction of shale gas economical, was first used in 1998 in the Barnett Shale in Texas. The energy from the injection of a highly pressurized fracking fluid creates new channels in the rock, which can increase the extraction rates and optimal recovery of hydrocarbons.
Energy extraction (also known as hydraulic fracturing) is the process of creating progressive fractures in a rock layer (shale) by a pressurized fluid. Some hydraulic fractures form naturally−certain veins or dikes are examples−and can create conduits along which gas and petroleum from source rocks may migrate to reservoir rocks. Induced hydraulic fracturing or hydrofracking, commonly known as fracking, is a technique used to release petroleum, natural gas (including shale gas, tight gas, and coal seam gas), or other substances for extraction. This type of fracturing creates fractures from a wellbore drilled into reservoir rock formations. Energy extraction is the use of fluid and material to create or restore small fractures in a formation in order to stimulate production from new and existing oil and gas wells. This creates paths that increase the rate at which fluids can be produced from the reservoir formations.
The process includes steps to protect water supplies. To ensure that neither the fluid that will eventually be pumped through the well, nor the oil (or gas) that will eventually be collected enters the water supply, steel surface or intermediate (cement) casings are inserted into the well to depths of between 1000 and 4000 feet. Once the cement has set, the drilling continues from the bottom of the surface or intermediate cemented steel casing to the next depth. This process is repeated, using smaller steel casings each time, until the oil and gas-bearing reservoir is reached (generally 6000–10,000 ft).
Proponents of fracking point to the economic benefits from vast amounts of formerly inaccessible hydrocarbons the process can extract. Opponents underline the potential environmental impacts, including contamination of groundwater, risks to air quality, the migration of gases and hydraulic fracturing chemicals to the surface, surface contamination from spills and flowback, and the health effects of these. For these reasons, hydraulic fracturing has come under scrutiny internationally, with some countries suspending or even banning it.
Energy extraction process
This article focuses on the required analytical parameters and techniques for water used in the process of hydraulic fracking. There are three stages in which water analysis is required: 1) fracking fluid (before pumping), 2) flowback water or produced water, 3) recycled water or make-up water for fracking fluids, and 4) wastewater.
Fracking fluid
Water and sand make up 98–99.5% of the fluid used in hydraulic fracturing. In addition, chemical additives such as acid solutions, scale inhibitors, stabilizing agents, corrosion inhibitors, friction reducing agents, and gelling agents are used; exact formulation will vary depending on the well. Analytical control of this water is necessary to ensure that no hazardous chemicals are pumped into the ground.
Flowback water or produced water
During the collection of natural gas after fracking, pressurized water pumped into the ground flows back, and is collected into a retaining pond near the site. Depending on the geochemical properties of the soil at every site, process control of heat, and chemicals used, this water will contain very high levels of inorganic and organic salts.
Make-up water or recycled water
Recycling of water is an absolute must, because it is not economical to use fresh water for first stages at every single pass. For the majority of the water volume, total dissolved solids (TDS), hardness, etc., are treated and removed before recycling of the water. Water recycling allows energy producers to reduce their cost. Testing for the water before and after treatment restricts waste of expensive chemicals.
Wastewater
A wastewater treatment plant requires an analytical report (analysis for discharge permits) for incoming water from the fracking industry to plan the treatment of the water.
Analysis of water at various stages of energy extraction
pH—U.S. EPA Method 150.2
The pH of a sample is determined electrometrically using either a glass electrode in combination with a reference potential or a combination electrode. Major interferences while measuring pH and remedies are:
- The glass electrode, in general, is not subject to solution interferences from color, turbidity, colloidal matter, oxidants, reductants, or high salinity. Sodium error at pH levels greater than 10 can be reduced or eliminated by using a low sodium error electrode.
- Coatings of oily material or particulate matter can impair electrode response. These coatings can usually be removed by wiping gently or washing with detergent, followed by rinsing with distilled water. An additional treatment with hydrochloric acid may be necessary to remove any remaining film.
- Temperature effects on the electrometric measurement of pH arise from two sources. The first is caused by the change in electrode output at various temperatures. This interference can be controlled with instruments having temperature compensation or by calibrating the electrode-instrument system at the temperature of the samples. The second source is the change of pH inherent in the sample at various temperatures. This error is sample dependent and cannot be controlled; it should therefore be noted by reporting both the pH and temperature at the time of analysis.
Hardness of water
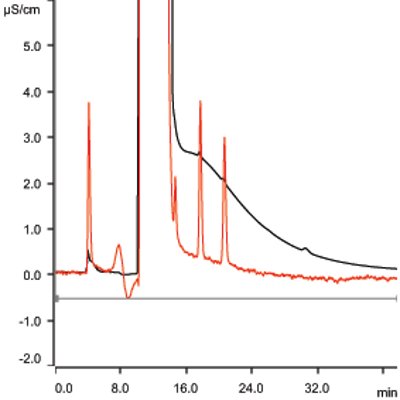
Figure 1 – Anions at 1.0 ppm in 30% NaCl solution. Black trace = conductivity; red trace = UV.
Hardness of water is monitored using U.S. EPA Method 130.2: Total Hardness of Water by Titrimetry. Calcium and magnesium ions in the sample are sequestered upon the addition of disodium ethylenediamine tetraacetate (Na2EDTA). The endpoint of the reaction is detected by means of an Eriochrome Black T indicator, which has a red color in the presence of calcium and magnesium and a blue color when the cations are sequestered.
Anions
Monitoring of fluoride, nitrite-N, nitrate-N, bromide, and sulfate is performed by modified U.S. EPA Method 300.1. Method modification is required in order to monitor trace-level nitrite-N in the presence of high levels of chloride. Figure 1 illustrates the required detection of 1.0 ppm fluoride, nitrite-N, bromide, nitrate-N, and sulfate in the presence of 300,000 ppm chloride. Table 1 lists the analytical conditions for ion chromatography (IC) for anions. Typical saturated brine solutions are viscous, and dilution may be required in order to reduce viscosity of the sample. In such cases, dilution of the sample is permitted as long as detection limits (1 ppm anions in 30% sodium chloride) are not compromised.
Cations
Monitoring of ammonia-N, calcium, magnesium, barium, and strontium is per ASTM D6919-08. ASTM D6919-08 is accepted by the U.S. EPA under the Method Update Rule (MUR) and permits the analysis of alkali and alkaline earth metals by ion chromatography. Modifying the mobile phase of this method to incorporate macro-cyclic ligands to separate ammonium ion from a high concentration of sodium ions makes IC analysis feasible for these types of waters. Figure 2 illustrates an example of cation separation. Shown in Table 2 are the analytical conditions for IC for cations. Typical saturated brine solutions are viscous, and dilution may be required in order to reduce viscosity of the sample. In such cases, dilution of the sample is permitted as long as detection limits (1 ppm cations in 30% sodium chloride) are not compromised.
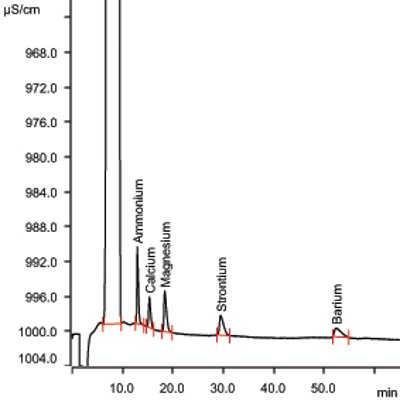
Figure 2 – Cations at 1.0 ppm in 30% NaCl solution.
Low-molecular-weight organic acids
There is no regulatory method currently available for the monitoring of organic acids such as lactate, formate, acetate, propionate, iso-butyrate, and butyrate. During the process of fracturing, up to 2% compositions of various household chemicals are used for corrosion control, gelling, lubricity, etc. These chemicals are mixtures of various polysaccharides (i.e., guar gum) and glycols (i.e., ethylene and propylene). It is believed that when these additive chemicals undergo treatment of pressure, heat, and friction, they break down into lower-molecular-weight organic acids that can pose a risk of rising pH, resulting in corrosion.
One of the biggest challenges is to monitor these low-molecular-weight organic acids in high salt content. This challenge was overcome by applying in-line removal of cationic species and analyzing these low-molecular-weight organic acids using the ion-exclusion principle with IC instrumentation. No derivatization step is required prior to analysis. Dilution of the sample is required in some cases.
Figure 3 and Table 3 illustrate the separation of organic acids in 30% NaCl solution after in-line cation removal and analytical conditions, respectively. Dilution of the sample is permitted as long as detection limits are not compromised.
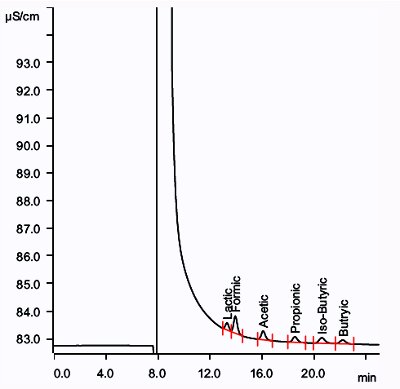
Figure 3 – Organic acids at 0.5 ppm in 30% NaCl solution.
Analytical techniques for the analysis of fracking fluids
Metrohm (Riverview, FL) provides typical ion analysis instrumentation for the energy extraction industry. The company also offers hyphenated techniques such as titration with Ion Chromatography (TitrIC) and Voltammetry with Ion Chromatography (VoltIC) to complement the required analysis with one report format, traceability of hardware, and ease of use.
In addition to the ion analysis technique discussed, several other analytical techniques are used for the analysis of fracking fluids. One of the more recent and most important analyses is dissolved gases and isotopic labeling of carbon (12C/13C) using isotope ratio mass spectrometry (IRMS).
Many laboratories use techniques such as electrochemistry, ICP-MS, and HPLC-MS. As per the recently published report from the U.S. EPA (January 2013), the historical collection of data for various analytes will define the specific use of instrumentation in regulatory methods.
Dr. Jay Gandhi, Ph.D., is Regulatory Affairs Manager, and Dr. Anne Shearrow is Senior IC Specialist, Metrohm USA, 6555 Pelican Creek Cir., Riverview, FL 33578, U.S.A.; tel.: 800-866-METROHM/800-638-7646; e-mail: [email protected]. Mr. Mathew is Senior Environment Scientist, U.S. EPA Region-6 Laboratories, Houston, TX, U.S.A. Disclaimer: Reference herein to any specific commercial products or nonprofit organization, process, or service by trade name, trademark, manufacturer, or otherwise, does not necessarily constitute or imply its endorsement, recommendation, or favoring by the United States Government. The views and opinions of the authors expressed herein do not necessarily state or reflect those of the United States Government and shall not be used for advertising or product endorsement purposes.