There are two schools of thought in interpreting the so-called positional fluctuation of peaks of IR spectra under the influence of environmental factors, i.e., temperature and concentration. The peak position change may be caused by the actual frequency shift of a single absorption band or alternatively by the relative intensity changes of overlapped bands. The classical view that has been widely accepted for many decades in the field of vibrational spectroscopy is that gradual changes occur in the vibrational frequency associated with a specific chemical bond. Many previous works concerning the peak position shift of IR spectra are based on the notion that the extent of frequency shift can be directly correlated with the level of specific molecular interactions, such as hydrogen bonding and dipole–dipole interactions.1–7 The apparent frequency shift of OH stretching or C=O stretching band under temperature or concentration change was attributed to the gradual weakening of such interactions. An alternative view is that the apparent peak position shift is caused by the change in the population of different chemical species. In this case, the position of peak maximum tends to shift due to the variation in the relative intensity contributions of closely overlapped bands with their individual frequencies essentially unchanged.
The authors recently examined a number of systems to explore the origin of positional or frequency fluctuation of spectral features to determine if positional fluctuation of spectral features is due to the gradual change in the vibrational frequency of chemical bond, the so-called real band frequency shift, or due to the change in relative contributions of two overlapped bands with fixed frequencies.8 It was noted that the apparent positional shift of spectral peak maximum in many, if not most, cases of IR studies can be better explained by assuming distinct species with fixed absorption frequencies, which vary only in their population and consequently their relative intensities. Principal component analysis (PCA) was used because it is a sensitive tool for detecting the presence or lack of true band frequency shift. The true positional fluctuation of spectral bands is fundamentally a nonlinear phenomenon. Consequently, a single absorption band continuously shifting in its frequency position cannot be adequately described as a simple linear combination of other adjacent bands with fixed and distinct frequency positions. A real band frequency shift, therefore, requires substantially more principal components (PCs) than normal PCA situations to fully capture the detailed intensity variations arising from the nonlinear effect. In contrast, an apparent positional shift of the peak maximum arising from the relative intensity changes of overlapped bands requires only a few significant PCs. Thus, the application of PCA to spectra exhibiting apparent peak shift should reveal the true origin of such spectral changes.
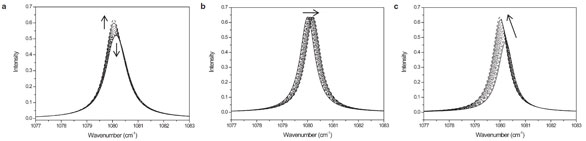
Figure 1 - The simulated model spectra comprising Lorentzian peaks in an arbitrary spectral region between 1077 and 1083 cm–1. There are a total of 10 systematically changing spectra for each set. The intensity changes of bands are indicated by the arrows: a) Two overlapped bands changing in intensity in opposite directions, b) a single band gradually shifting in position from a lower to a higher wavenumber, and c) a single band simultaneously shifting in position from a higher to a lower wavenumber and increasing in intensity. (Figures 1–3 reproduced with permission from Ref. 8.)
The authors first analyzed a set of the simulated model spectra comprising Lorentzian peaks in an arbitrary spectral region of 1077–1083 cm–1. Figure 1a shows the spectral variations arising from the intensity changes of two highly overlapped adjacent bands with fixed band positions and relative line shapes. One band increases in intensity, while the other decreases in intensity, as indicated by the two arrows. Figure 1b represents the spectral variations where the position of an isolated single band, with a fixed intensity and line shape, is gradually shifted along the spectral axis in the direction of the arrow. Figure 1c depicts the spectral variations where the band position shift is coupled with a simultaneous intensity increase.
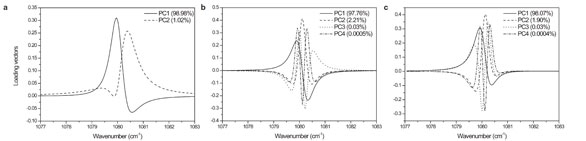
Figure 2 - Loading plots of PCA for the simulated spectra shown in Figure 1.
To identify if the frequency shift of spectral changes is due to the relative intensity changes of two overlapped bands or real band position shift, PCA was applied to the simulated spectra. The corresponding loading plots of PCA for the simulated spectra shown in Figure 1 are presented in Figure 2. For the simulated spectral data of two overlapped bands, changing in intensity in opposite directions as shown in Figure 1a, only a few PCs are required to capture essentially all information needed to describe the simulated spectral data of two overlapped bands. In contrast, the simulated spectra of a single band gradually shifting in position (shown in Figure 1b) and those of a single band simultaneously shifting in position and increasing in intensity (Figure 1c) need many more PCs to describe these simulated spectral data. The PCA of simulated peak shift, due to a single band gradually shifting in position or to a single band simultaneously shifting in position, demonstrates very distinct results. A large number of higher-order PCs are required to adequately describe the nonlinear features of these simulated spectral data. In contrast, the peak maximum shift due to relative intensity changes of two overlapped bands needs only a few PCs. It clearly demonstrates the difference between the apparent peak frequency shifts of spectra, due either to the relative intensity changes of two overlapped bands or true frequency change of a single band. A complete interpretation of so-called “band shift” phenomena by PCA can thus be provided.
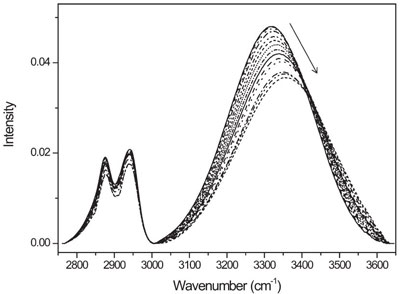
Figure 3 - Temperature-dependent FTIR spectra of ethylene glycol obtained during heating from 25 to 155 °C.
This simple diagnostic tool was applied to a number of IR spectra of real chemical systems exhibiting the apparent peak position shifts under temperature and concentration changes, especially those with the OH stretching and C=O stretching vibrations representing hydrogen bonding and dipole–dipole interactions. Figure 3 shows a typical example of the gradual position shift and width change of an absorption peak of ethylene glycol under varying temperature. The shift of the OH stretching peak to a higher wavenumber direction upon heating is often attributed to the weakening of the hydrogen bonding interaction, which gradually changes the vibrational frequency of this band. If that is the case, we should expect that a large number of factors will be required for PCA to fully describe such nonlinear spectral feature changes. It turned out that only two PC factors were enough to construct the PCA model for this system. In other words, the IR spectrum at any temperature within the measurement range could be expressed as a linear combination of two spectral features, representing different species.